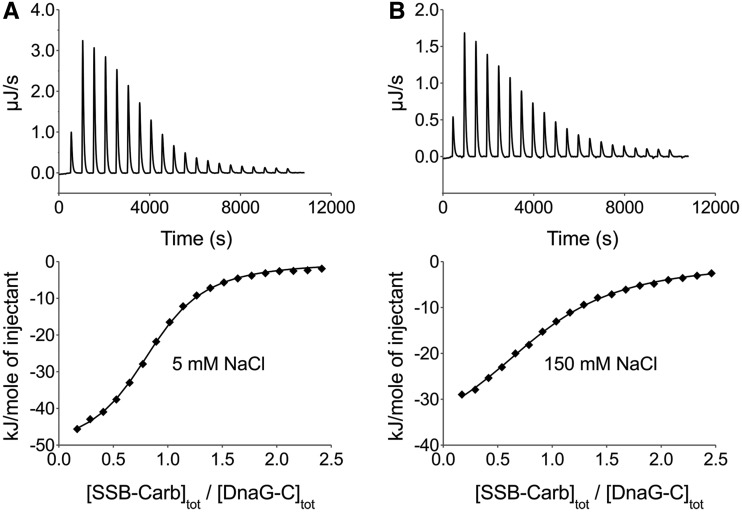
Figure 4.
Interaction of DnaG-C with the SSB-Carb peptide as investigated by ITC at different salt concentrations. Upper panels show the raw data obtained for 20 automatic injections of SSB-Carb peptide into the sample cell containing DnaG-C. Lower panels give the integrated heat responses per injection, after correction for heats of dilution obtained by titrating SSB-Carb into sample buffer, normalized to the moles of injected peptide. (A) In a buffer containing 5 mM NaCl, 1.04 mM SSB-Carb were titrated into a solution of 46 µM DnaG-C. (B) In a buffer containing 150 mM NaCl, 1.08 mM SSB-Carb were titrated into a solution of 46 µM DnaG-C. Solid lines represent the best fit with a model of n identical independent binding sites for SSB-Carb on DnaG-C with (A) n = 0.84, KA = 2.4 × 10⁵ M−1, ΔH = −52.0 kJ/mol and (B) n = 0.89, KA = 7.4 × 10⁴ M−1, ΔH = −41.3 kJ/mol. Note that raw data of the Nano ITC calorimeter show a positive sign if heat production occurs during the reaction.

