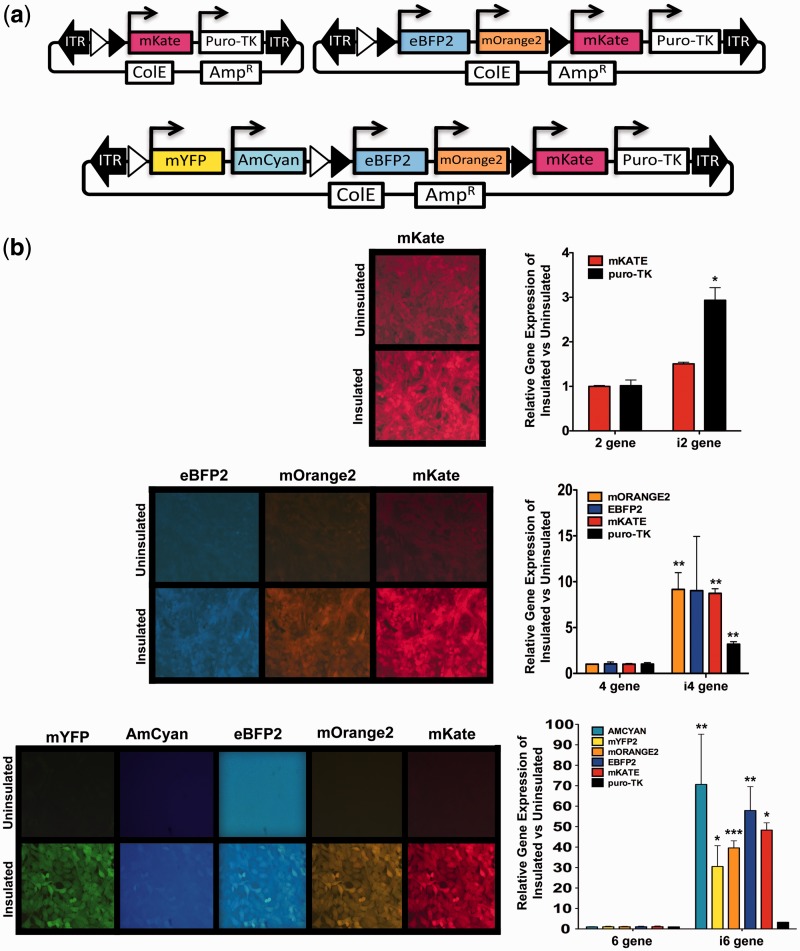
Figure 3.
Expression of stably integrated multigene transposon vectors in NIH 3T3 cells. (a) Diagram of vectors containing one, three or five fluorescent proteins along with the puromycin-tk (puro-tk) fusion. (b) Representative fluorescence photomicrographs and QRT-PCR analysis of stably integrated insulated and uninsulated multigene vectors. Expression levels are normalized to uninsulated vector gene expression for direct comparison of insulated and uninsulated vectors. P-values were calculated using a two-tailed unpaired t-test (P > 0.0001***, P > 0.001**, P > 0.01*).

