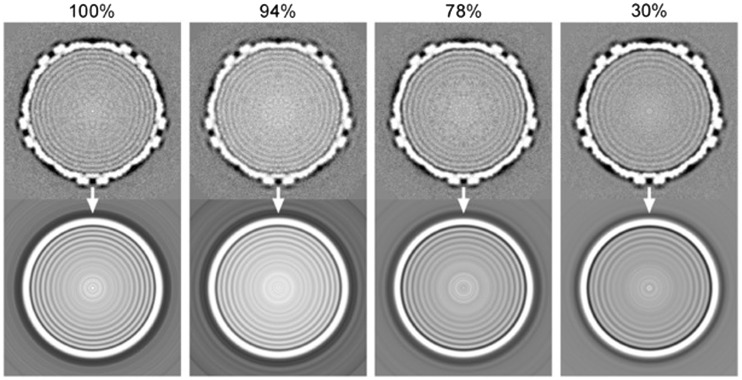
Figure 2.
Central slices through the 3D cryo-EM reconstructions of the lambda phage containing different amounts of DNA (above) and the radially averaged images that were used for measuring the spacing (below). The percentage of packaged DNA relative to the wt phage is listed above each row. Only the outermost 4 or 5 rings of DNA have sufficient ordering to be used in calculating inter-DNA spacing. Note that the centre of the 30% packaged phage exhibits intensities are higher than that of the background, indicating that there is DNA present at the centre of the capsid.

