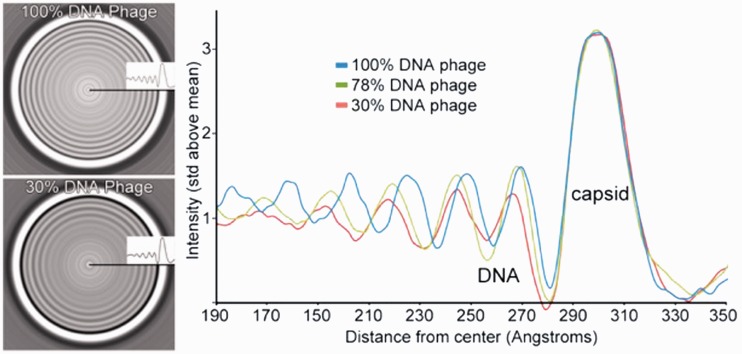
Figure 3.
Only the well-ordered peripheral rings of DNA were used to generate a 1D plot of the radially averaged central slices of the phage reconstructions. Shown are the radially averaged cross-sections for the 100% wt DNA-length and the 30% DNA-length (left). The 1D plots for the 100, 78 and 30% DNA-length phages are shown on the right.

