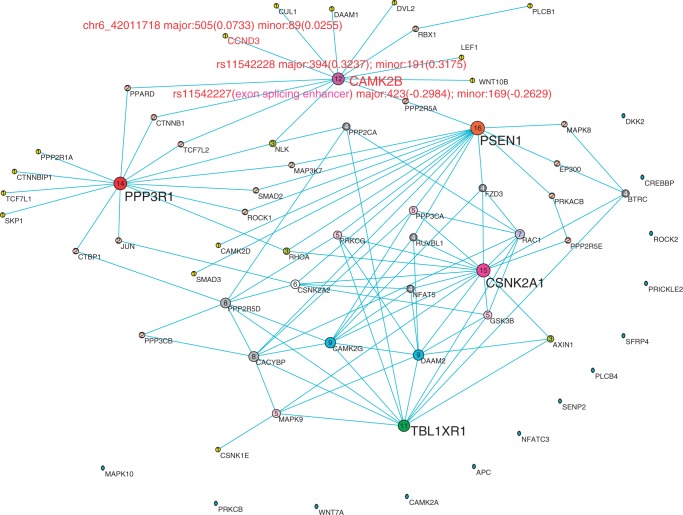
Figure 5.
The co-expression network reconstructed by bivariate CCA method using ASE RNA-seq data of schizophrenia tissue samples. Nodes are sized, numbered and coloured according to their degree value. The important SNPs in genes are represented by their names, expression value and their CCA coefficients in the figure and described elaborately in the article.

