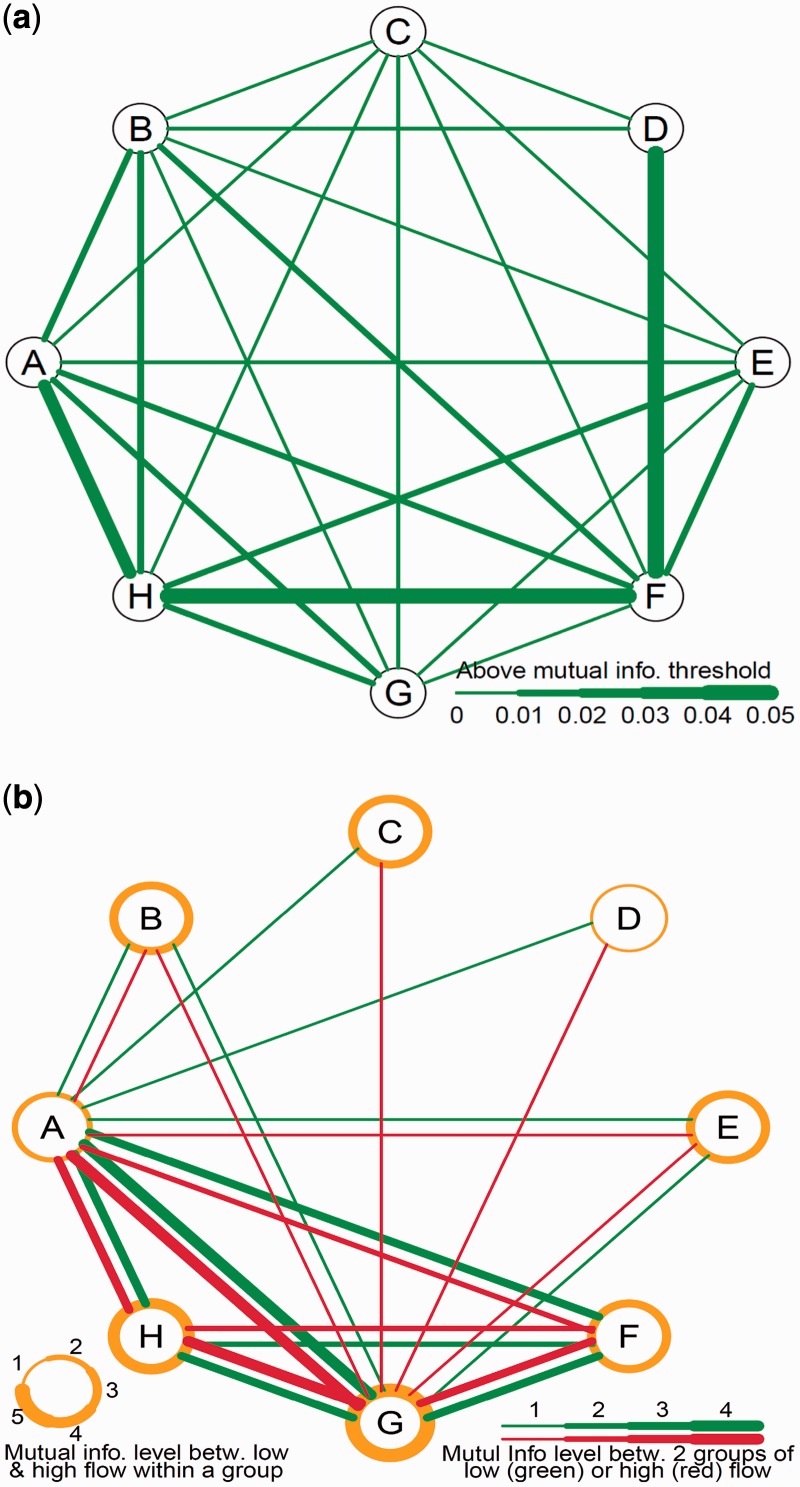
Figure 2.
Regulatory network of eight groups of rabbit genes expressed in high and low flows. (a) Between-group network reconstruction based on average value of expression between the two treatments. (b) Within- and between-group network reconstruction based on gene expression separately in low and high flows. The thickness of a circle represents the level of mutual information between two treatments within a group, whereas the thickness of lines represents the level of mutual information between two groups in low (green) and high flows (red). The lines representing mutual information below the average level are omitted.

