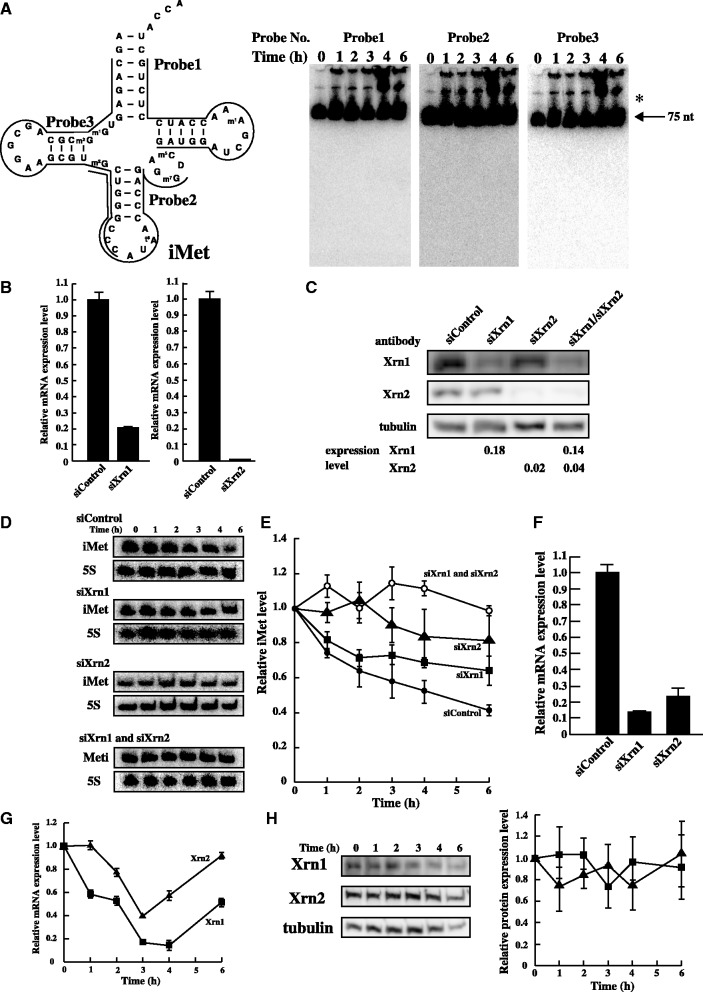
Figure 6.
Degradation of tRNA(iMet) by Xrn1 and Xrn2 under heat stress. (A) To identify nuclease(s), a large amount of total RNA (50 µg) was loaded. tRNA(iMet) sequence and the three probe positions that were targeted are shown (left). tRNA(iMet) was detected by northern blot analysis using the three probes (right). Arrow shows mature tRNA(iMet) and asterisk shows the precursor-tRNA(iMet). (B) mRNA level of Xrn1 or Xrn2 by knock-down using specific siRNA was analysed by Real-time PCR. HeLa cells were transfected with non-targeting control siRNA, siXrn1 (left) and siXrn2 (right). (C) Efficiency of knock-down using specific siRNA was determined by western blot analysis. Tubulin was used as a control. (D) Quantification of tRNA(iMet) and 5S rRNA in heat-treated HeLa cells. Knock-down of Xrn1, Xrn2 or Xrn1/2 was detected by northern blot analysis. (E) Degradation profile of tRNA(iMet) was calculated in heated HeLa cells treated with specific siRNA. Filled circles, non-targeting control; squares, siXrn1 treated; triangles, siXrm2 treated; opened circles, double knock-down after treatment with siXrn1 and siXrn2. Degradation of tRNA(iMet) was normalized by 5S rRNA. Data represent the mean±SD for three independent experiments. (F) Double knock-down level of Xrn1 and Xrn2 was analysed by Real-time PCR. (G) mRNA expression levels of Xrn1 (square) and Xrn2 (triangle) were analysed by Real-time PCR under heat stress. (H) Protein expression level of Xrn1 (square) and Xrn2 (triangle) was analysed by western blotting. Tubulin was used as a control.

