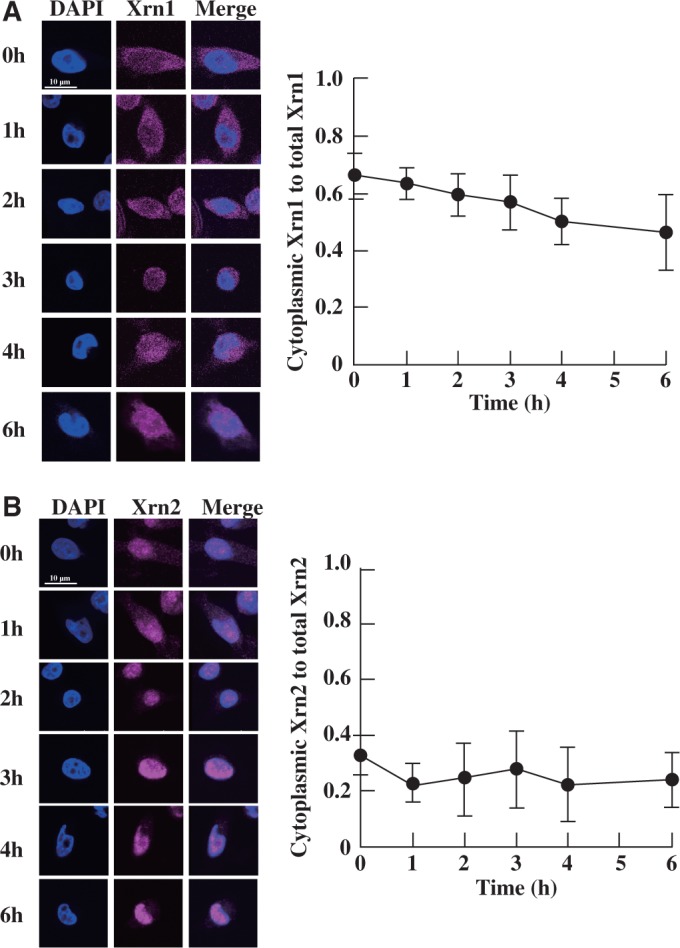
Figure 7.

Immunofluorescence of Xrn1 and Xrn2 during heat stress. HeLa cells were heat shocked for different lengths of time, and the localization of Xrn1 and Xrn2 was determined at each time point. Altered localization of Xrn1 (A, left) or Xrn2 (B, left) was analysed by immunofluorescence. Ratio of cytoplasmic Xrn1 to total Xrn1 (A, right) or Xrn2 to total Xrn2 (B, right) is shown. Quantification of fluorescence was performed in 40 cells per hour, and the results were averaged. Data represent the mean±SD (n = 40).
