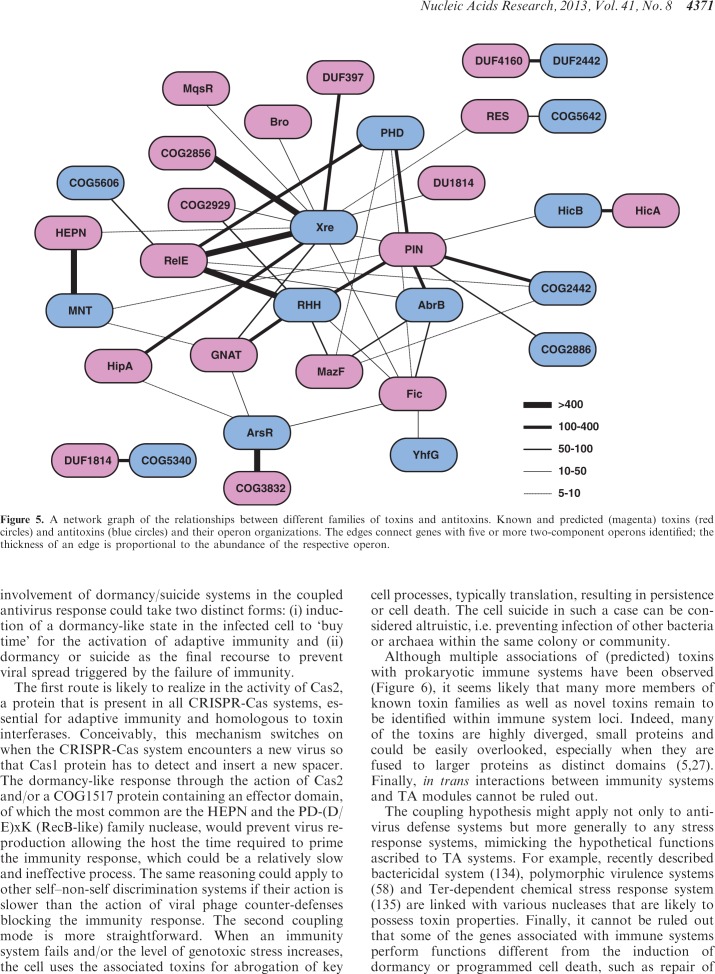
Figure 5.
A network graph of the relationships between different families of toxins and antitoxins. Known and predicted (magenta) toxins (red circles) and antitoxins (blue circles) and their operon organizations. The edges connect genes with five or more two-component operons identified; the thickness of an edge is proportional to the abundance of the respective operon.

