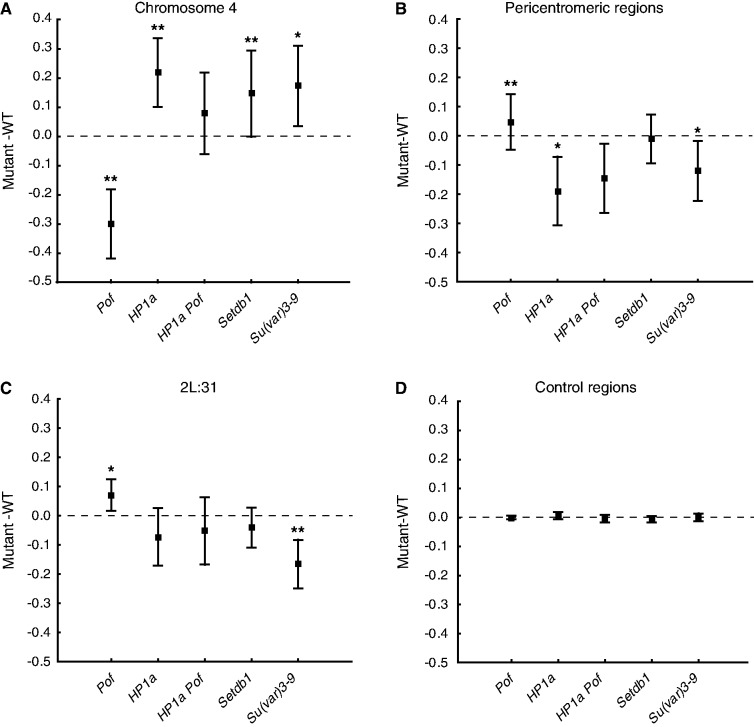
Figure 2.
HP1 inhibits gene expression on the 4th chromosome and induces gene expression in pericentromeric regions. The mean expression ratio (log2 scale) detected by Affymetrix expression arrays in Pof, HP1a, HP1a Pof, Setdb1 and Su(var)3-9 mutants versus wild-type in (A) chromosome 4, (B) pericentromeric regions, (C) cytological region 2L:31 and (D) control (all active genes, except within the three tested regions). Squares indicate the mean value and whiskers indicate the 95% confidence interval. Dashed lines indicate no change in expression ratio. Wilcoxon matched pairs test was used to estimate the significant difference between the average absolute mutant expression level and average absolute wild-type expression level. ** indicates significant at P < 0.01 and * indicates significant at P < 0.05. (Sample sizes for the Pof mutant were nchr4 = 69, npericentromeric = 79, n2L:31 = 71 and ncontrol = 9131, and for the other mutants, nchr4 = 77, npericentromeric = 82, n2L:31 = 72 and ncontrol = 9356).

