Figure 3.
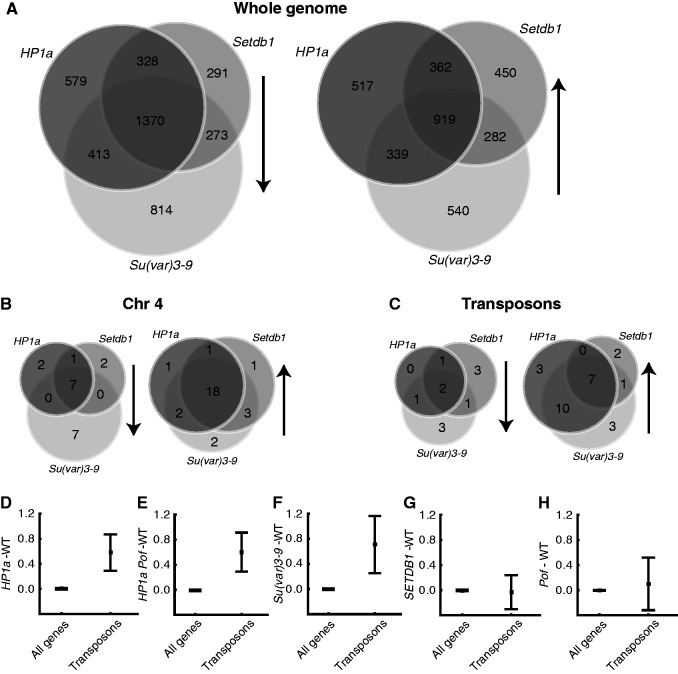
SETDB1 and Su(var)3-9 display extensive overlapping functions at both genome-wide and chromosome-4 levels. Differentially up- or down-regulated genes from each mutant are compared in a Venn diagram to identify genes that are co-regulated by HP1a, SETDB1 and Su(var)3-9. Genes were defined as differentially up- or down-regulated if none of the three mutant replicates overlapped with any of the three wild-type replicates and if the ratio between mutant and wild-type median values was greater than 0.2 (log2 scale). (A–C) Differentially down-regulated genes (left diagram) or up-regulated genes (right diagram) in the whole genome (A), on chromosome 4 (B) and transposons (C). (D–H) Mean expression ratio (log2 scale) for transposons (n = 32 for Pof mutant and n = 40 for the other mutants) compared with the rest of the genome (n = 9318 for Pof mutant and n = 9547 for the other mutants) in HP1a (D), HP1a Pof (E), Su(var)3-9 (F), Setdb1 (G) and Pof (H) mutants compared with the median of six wild-type replicates (three wild-type replicates for the Pof mutant). Whiskers indicate the 95% confidence interval.

