Figure 4.
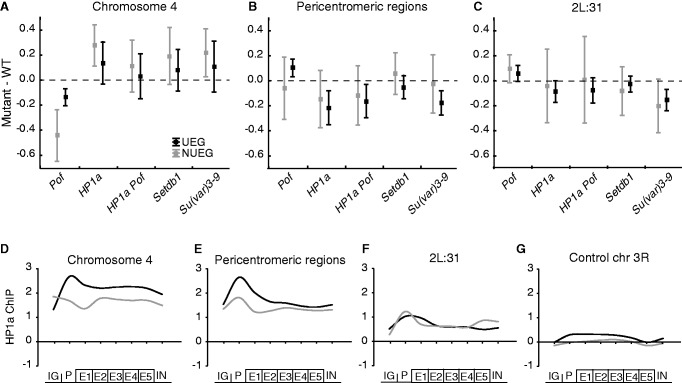
HP1a preferentially inhibits NUEGs on chromosome 4 and stimulates expression of UEGs in pericentromeric regions. The mean expression ratio (log2 scale) of NUEG (gray boxes) and UEG (black boxes) genes in Pof, HP1a, HP1a Pof, Setdb1 and Su(var)3-9 mutants in, (A) chromosome 4 (NUEGs: n = 37, UEGs: n = 32 for Pof mutant and NUEGs: n = 45, UEGs: n = 32 for the other mutants), (B) in pericentromeric regions (NUEGs: n = 27, UEGs: n = 52 for Pof mutant and NUEGs: n = 30, UEGs: n = 52 for the other mutants) and (C) in cytological region 2L:31 (NUEGs: n = 19, UEGs: n = 52 for Pof mutant and NUEGs: n = 20, UEGs: n = 52 for the other mutants). Squares indicate the mean value and whiskers indicate the 95% confidence interval. Dashed lines indicate no change in expression ratio. (D–G) Average meta-gene profiles of HP1a binding in NUEG (gray lines) and UEG (black lines) genes on chromosome 4 (D), pericentromeric regions (E), cytological region 2L:31 (F) and chromosome 3R as an HP1a-unbound control region (G). The profiles were compiled based on all active genes in the four regions in a wild-type background and each profile was generated on eight enrichment values on the x-axis. The first point of the curve is an average of the intergenic region upstream of the designated promoter of each gene. The promoter was defined as the 500-bp region upstream of the TSS. The gene body was divided into five bins, and the average enrichment in introns is the last point on the curve. The y-axis shows enrichment on a log2 scale.

