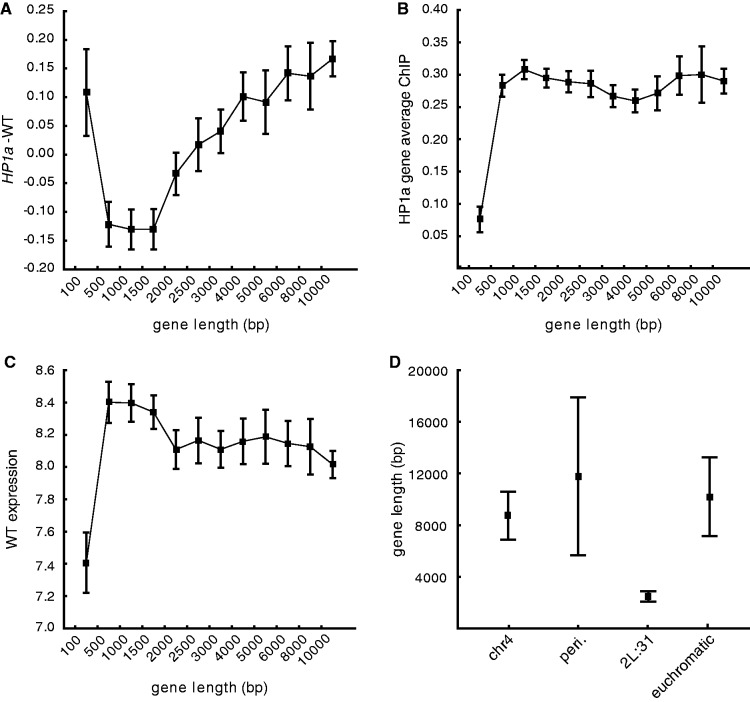
Figure 5.
HP1a inhibits gene expression of long genes and stimulates expression of short genes. (A) Mean plot of expression ratio in an HP1a mutant versus wild-type plotted against bins of gene length (defined as length between transcriptional start and stop sites in kb, sample number is from lowest to highest bins; 473, 1255, 1321, 1189, 897, 662, 930, 592, 425, 565, 348 and 1405, respectively). (B) Mean plot of average HP1a binding values of all genes plotted against bins of gene length. (C) Mean plot of wild-type expression value plotted against bins of gene length. (D) Average gene length (of the active genes that are included in this study) in the different HP1a binding regions: chromosome 4 (n = 78), pericentromeric regions (n = 88), cytological region 2L:31 (n = 72) and in the remaining euchromatic genome (n = 9824). All y-axis values are on a log2 scale and whiskers indicate the 95% confidence interval.

