Figure 4.
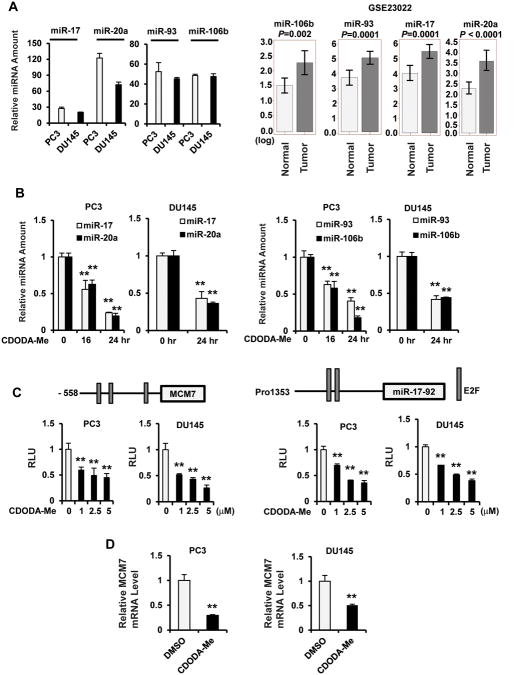
MiR paralog expression and regulation in prostate cancer cells. (A) Expression in cells and patients. MiR levels in PC3 and DU145 cells were determined by real time PCR as described in the Materials and Methods, and expression in tumors was obtained from publically available results (GSE23022). Effects of CDODA-Me on miR expression (B) and luciferase activity (C). Cells were treated with 2.5 μM CDODA-Me for 24 hr (B) or transfected with promoter construct from MCM7 gene and miR-17-92 cluster (C) promoters. MiR levels and luciferase activities were determined as outlined in the Materials and Methods. (D) MCM7 expression. Cells were treated with 2.5 μM CDODA-Me for 24 hr and MCM7 mRNA levels were determined by real time PCR as outlined in the Materials and Methods. The significance (p < 0.05) of treatment-related decreases are indicated (**), and the level of significance for the patient data (A) is indicated.

