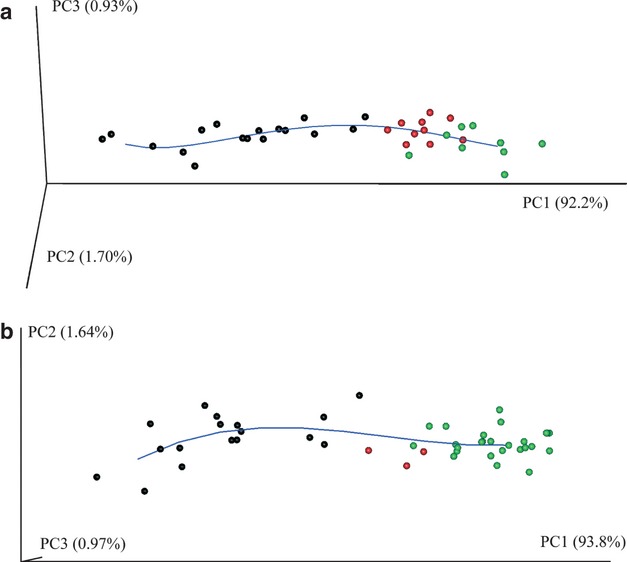
Fig. 5.

(a) Scatterplot of the first three principal components (PCs) of Procrustes form space of the mandibular surfaces, muscles and tooth coordinates. The blue line is a local linear regression through these points; it represents the average ontogenetic trajectory. (b) Scatterplot of the first three PCs of Procrustes form space of the 2D craniofacial block. The blue line is a local linear regression through these points representing the average ontogenetic trajectory.
