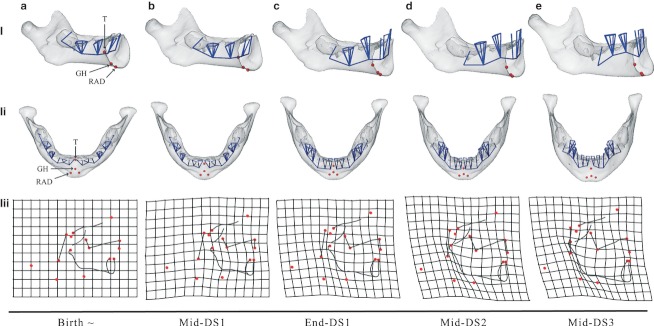
Fig. 6.

Morphs of the human mandibular surfaces (i, ii) and the craniofacial block (iii) from birth to mid-DS3 based on the regression in Fig. 5a (cross-sectional) and Fig. 5b (longitudinal). They are scaled to constant overall CS. (i, ii) Translucent surfaces enable the visualization of the position and orientation of deciduous teeth and the floor of the tooth chambers (blue), as well as muscle landmarks (red): the tongue (T), the genio-hyoid muscle (GH), and the anterior belly of the right and left digastric muscles (RAD and LAD). (iii) TPS deformation grids of the craniofacial block from each age stage to its next older stage. TPS grids visualize developmental shape change (exaggerated by factor of 2) after birth. Red dots: landmarks as in Fig. 4 and Table 1.
