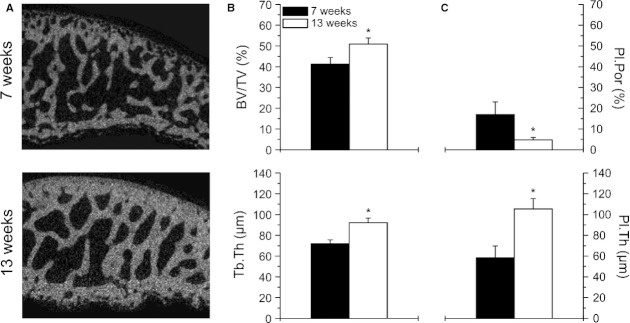
Fig. 6.

Micro-CT analysis of the subchondral bone in the weight-bearing area of the tibia. (A) Structural differences of the subchondral plate and subchondral trabecular bone between the two age groups. (B) Bone volume fraction (BV/TV) and trabecular thickness (Tb.Th) of the subchondral trabecular bone of the 7-week-old (n = 12) and 13-week-old (n = 12) animals. Values are means ± SD. (C) Plate porosity (Pl.Por) and plate thickness (Pl.Th) of the subchondral plate of the 7-week-old (n = 12) and 13-week-old (n = 12) animals. Values are means ± SD. Significant differences are indicated: *P < 0.001.
