Figure 6.

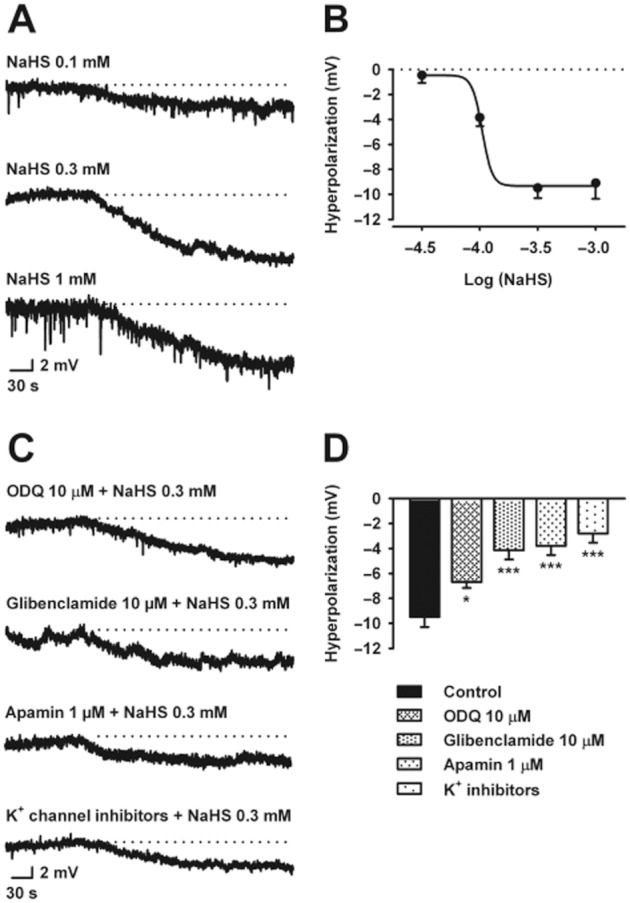
Intracellular microelectrode recordings showing the effect of NaHS (0.1 – 1 mM) on resting membrane potential in the rat mid colon (A). Dotted lines indicate the resting membrane potential. Concentration-response relationship for NaHS (B). Intracellular microelectrode recordings showing the hyperpolarization caused by NaHS (0.3 mM) in the presence of (i) ODQ (10 μM); (ii) glibenclamide (10 μM); (iii) apamin (1 μM); and (iv) a cocktail of potassium channel blockers including apamin (1 μM), TRAM-34 (1 μM), glibenclamide (10 μM) and charybdotoxin (0.1 μM) (from the top) (C). Dotted lines indicate the resting membrane potential. Histogram showing the effect of the different drugs mentioned above on the hyperpolarization produced by NaHS (0.3 mM) (D). All values are mean ± SEM. n = 4 for each experiment. *P < 0.05, ***P < 0.001, significant difference from control; one-way ANOVA, followed by Bonferroni's multiple comparison test.
