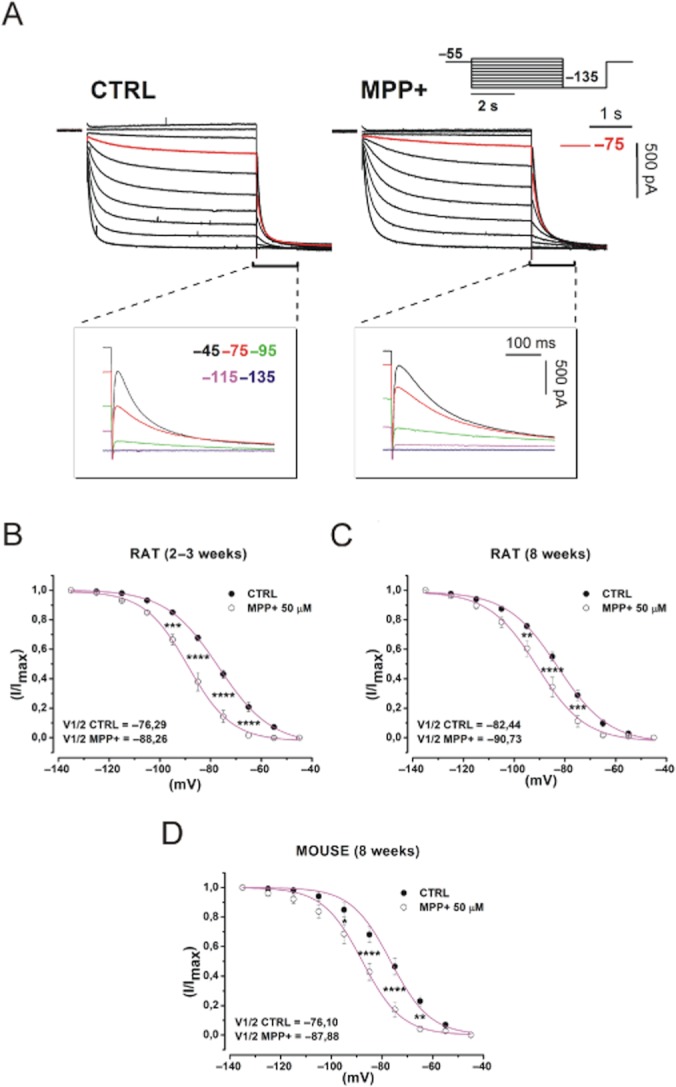
Figure 3.

MPP+ changes the voltage dependence of Ih. (A) Whole-cell currents elicited with a family of hyperpolarizing potentials (scheme). Currents evoked at −75 mV are highlighted in red. Enlargements show tail currents obtained at the indicated potentials. (B, C, D) Ih activation curve obtained by plotting normalized tail currents versus potential in control conditions (closed circles) and MPP+ 50 μM (open circles) in SNc DA neurons from juvenile rats (B), adult rats (C) and C57/BL6 male mice (D). P-values were obtained with one-way anova with Bonferroni post hoc analysis. Curves were fitted with a Boltzmann equation. CTRL, control.
