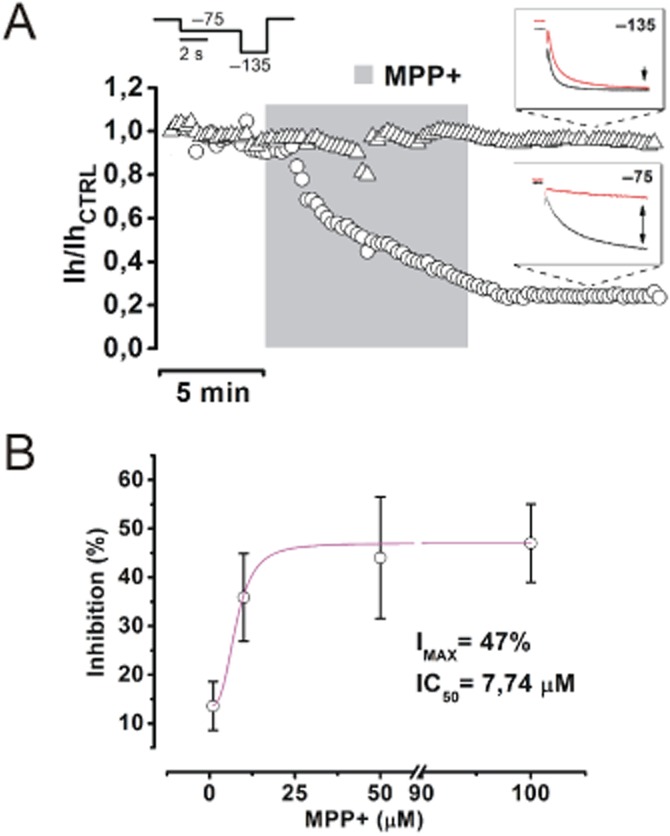
Figure 4.

MPP+ inhibits Ih in a voltage- and concentration-dependent manner. (A) A time course of the effect of MPP+ 50 μM on Ih at −75 (circles) and −135 mV (triangles) was obtained with the double-pulse protocol shown above. Insets show typical currents evoked before (black) and after (red) MPP+ (−75 mV = −44.38 ± 7.39%, n = 8, P = 5.4 × 10⁻⁴; −135 mV = −5 ± 5.4%, n = 8, P = 0.4. (B) Concentration-inhibition curve obtained by fitting values of inhibition (in percentage of control) at −75 mV, in presence of 1 (n = 5), 10 (n = 5), 50 (n = 5) and 100 μM MPP+ (n = 6). Values of IMAX (47%) and IC50 (7.74 μM) were obtained by fitting the curve with a logistic equation (Methods).
