
Figure 6.
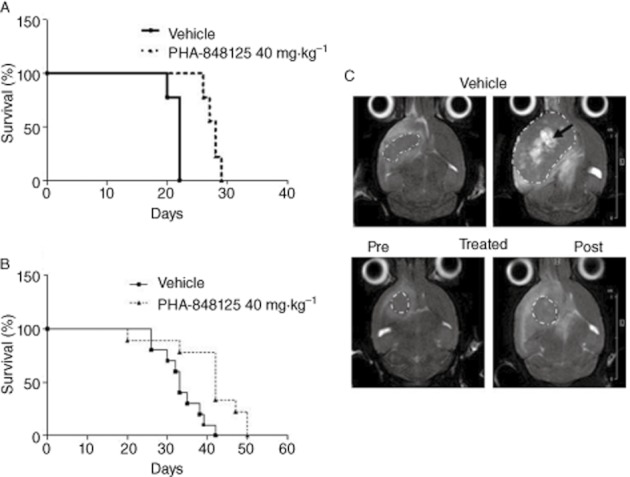
In vivo anti-tumour efficacy in intracranially (i.c.) implanted tumour. (A) Survival curves of mice with U251 cells i.c. implanted, treatment for 10 consecutive days starting from the day after cell injection; (B) survival curves of mice with U251 cells i.c. implanted, treatment for 20 consecutive days starting from day 15 after cell injection; (C) MR images of one representative control and one treated mouse pre-treatment (day 15) and the day after the last treatment (day 35). Tumours (encircled by white dotted lines) are surrounded by a hyper-intense oedematous area; big and fast growing tumours also present necrotic areas (black arrow). Significantly smaller tumours (P = 0.0061) are found in the treated cohort (0.056 ± 0.023 cm3 vs. 0.195 ± 0.05 cm3 in the vehicle group).