
Figure 6.
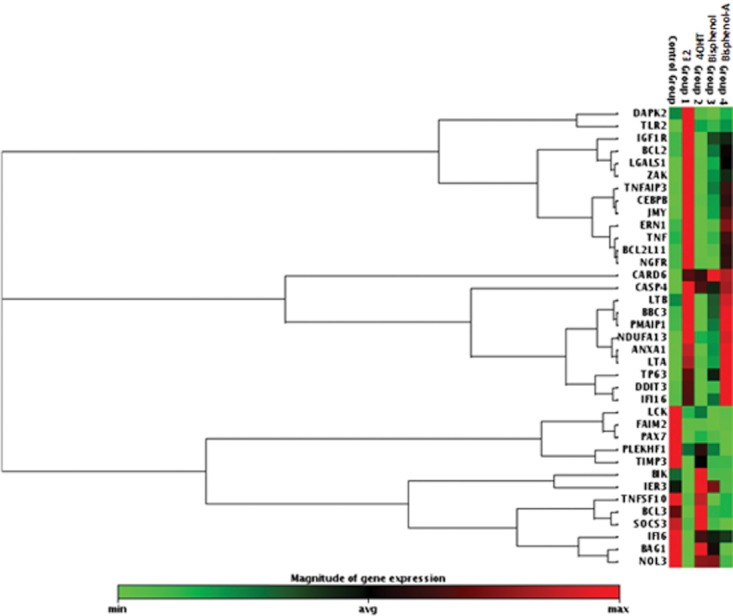
Heat map of apoptotic genes which are at least 2.5-fold up- or down-regulated by 48 h of treatment of 17β-oestradiol 10−9 M (E2), versus vehicle and its relative comparison of their expression with 4-hydroxy tamoxifen, 10−6 M (4OHT), bisphenol, 10−6 M (BP) and bisphenol A, 10−6 M (BPA) treatment after 48 h in MCF7 : 5C cells. The maximum expressed level of any given gene is represented by red colour and minimum levels are presented as green colour. Control group and group 1, 2, 3, 4 are the representation of the vehicle, E2, 4OHT, BP and BPA treatments respectively. The gene expression levels in each treatment group are the average of three independent biological replicates.