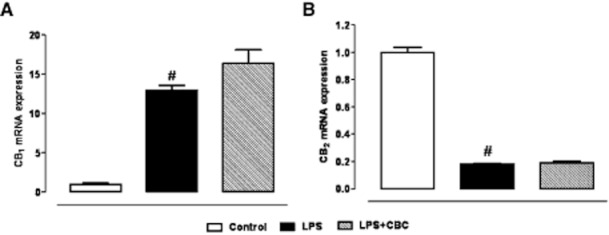
Figure 7.

Relative mRNA expression of cannabinoid CB1 receptor (A) and cannabinoid CB2 receptor (B) in cell lysates from macrophages incubated or not with lipopolysaccharide (LPS, 1 μg·mL−1) for 18 h: effect of cannabichromene (CBC, 1 μM, added to the cell media or 30 min before LPS challenge). The expression levels of mRNA, evaluated by qRT-PCR and normalized with respect to the reference genes, was scaled for all conditions to the expression value of the control, considered as 1. The means of the quantitative-cycles (Cq) for the control values were: 31.2 (CB1 receptor) and 24.48 (CB2 receptor). The reaction background was 37.30 Cq and 36.60 Cq for CB1 receptor and CB2 receptor, respectively, at 40 reaction cycles. #P < 0.001 versus control (n = 4).
