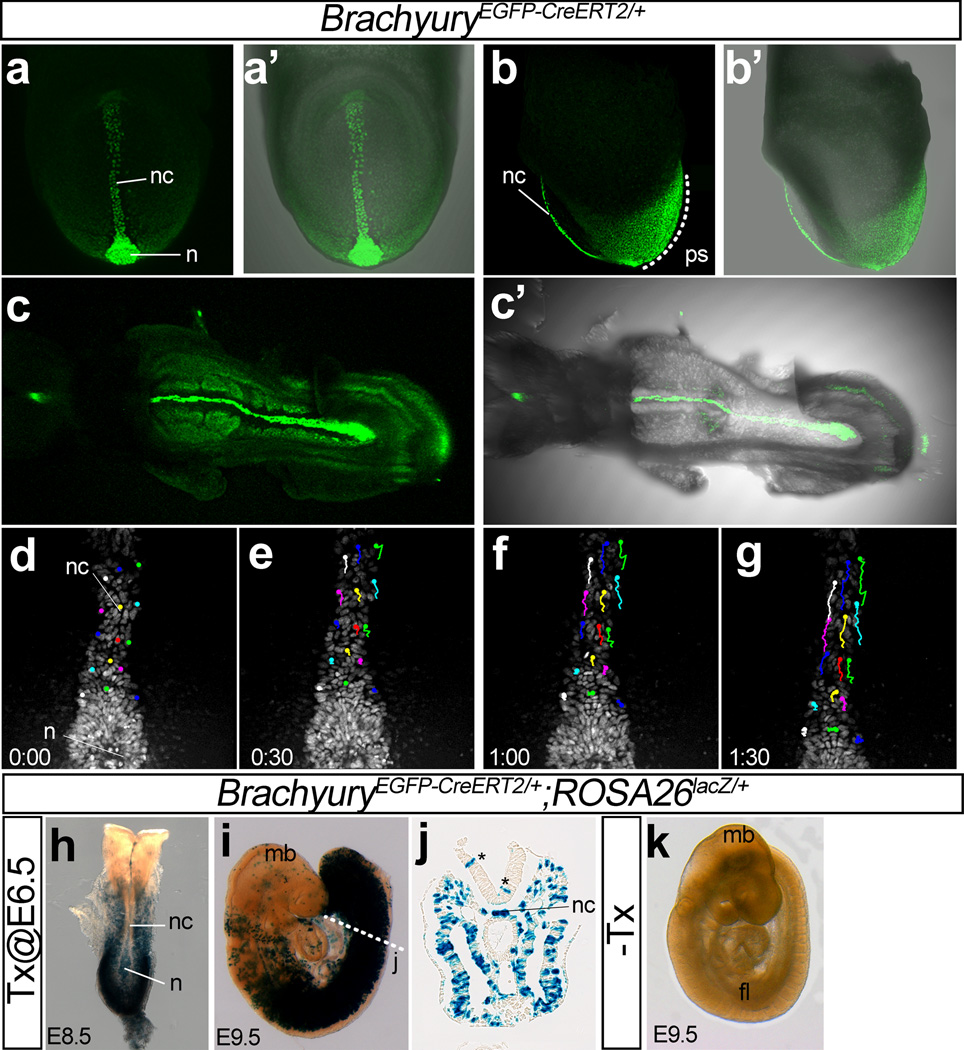
Figure 4. Characterization of TnEGFP-CreERT2/+ embryos.
(a–c) Expression of nuclear EGFP in TnEGFP-CreERT2/+ embryos. Frontal (a, a’) and left side (b, b’) views of an E7,75 embryo, and ventral views of an E8.5 embryo (c, c’). The EGFP signal was observed in the nuclei of the cells in the node, the notochord, and wide range of the posterior mesoderm.
(d–g) Snapshot images of a time-lapse movie of EGFP expression of a TnEGFP-CreERT2/+ embryo starting from E7.75. The number in each panel indicates the elapsed time (hour: minutes). Color lines indicate traces of cellular movements.
(h–k) Induction of Cre recombinase activity in TnEGFP-CreERT2/+;ROSA26lacZ/+ embryos by administration of Tx. Tx administration at E6.5 induced Cre-mediated recombination in the node and wide range of posterior mesoderm. β-galactosidase activity at E8.5 (h, dorsal view) and E9.5 (i, left side view; j, a cross section close to the posterior end of the notochord). Asterisks in panel j indicate examples of β-galactosidase–positive cells that do not express endogenous T. No β-galactosidase activity was observed without Tx (k).
Abbreviations: n, node; nc, notochord; ps, primitive streak.

