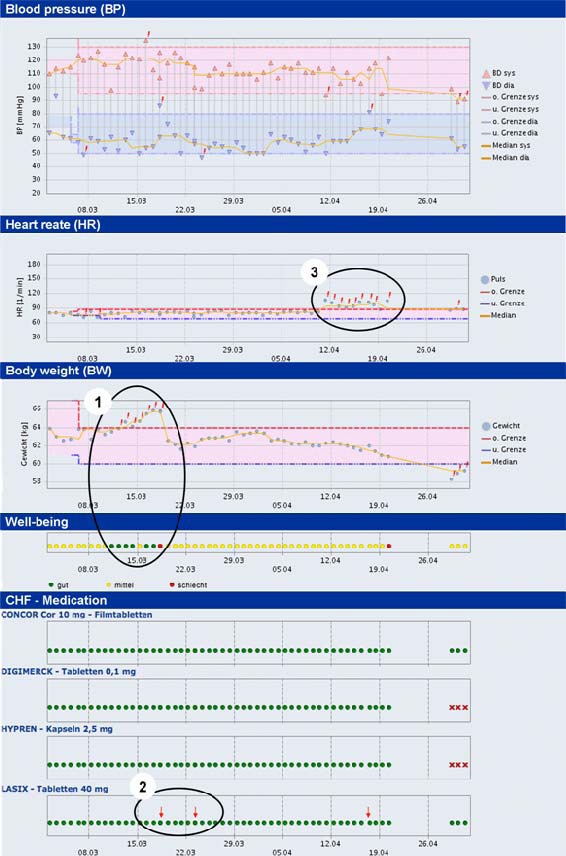
Figure 4.

Typical trend chart of a patient (male, 82 years) over a period of about two months of telemedical follow-up. Each dot represents a transmitted value of (from top to bottom) systolic and diastolic blood-pressure, heart rate, body weight, well-being, and CHF medication.
Episode 1) Increase of body weight led to off-limit conditions indicated by red exclamation marks. During the first days of this episode the patient indicated his well-being status mostly with “good” follow by “bad” on the day before the intervention.
Episode 2) Physicians reacted on the trend and temporarily increased the dosage of diureticum indicated by the red arrows resulting in a reduction of the body weight.
Episode 3) Because of an ongoing increase in heart rate over a period of eight days the patient was hospitalized to examine the presence of cardiac arrhythmia. Again the patient indicated “bad” well-being on the last day before hospital admission.
