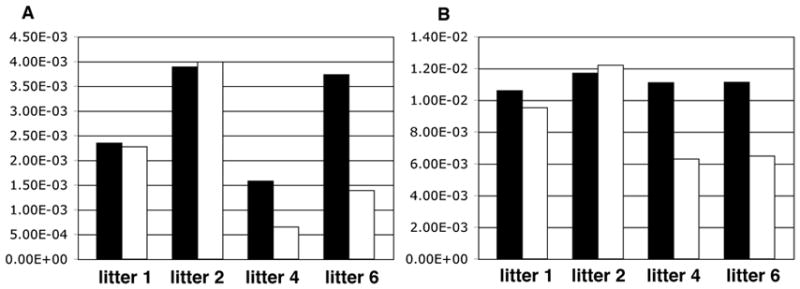
Fig 3.

Gnrhr expression level in Lhx3−/−;Lhx4−/− and control placentas
A: Relative ratio of Gnrhr/Tubb3 in Lhx3−/−;Lhx4−/− and control placentas; B: Relative ratio of Gnrhr/Gapdh Lhx3−/−;Lhx4−/− and control placentas. Black column: gene expression level in Lhx3−/−;Lhx4−/− placentas. White column: gene expression level in control placentas. For detailed information on mutant and control placentas see Suppl. Table 2.
