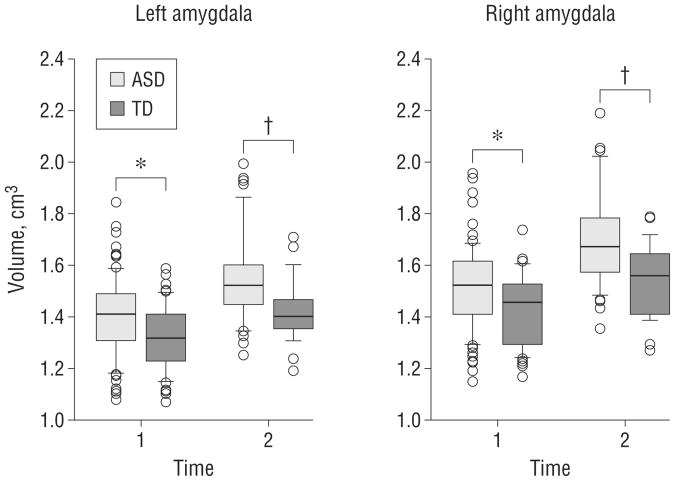
Figure 2.
Group comparison of amygdala volumes at both magnetic resonance imaging time points. The box plots depict the median and 25th and 75th percentiles. The whiskers denote the 10th and 90th percentiles. Values above the 90th and below the 10th percentiles are plotted as points The amygdala is enlarged in the autism spectrum disorder (ASD) group at both time points, but the magnitude of the difference is greater at time 2. TD indicates controls with typical development. *P< .05. † P< .01. P values are adjusted for age and total cerebral volume.

