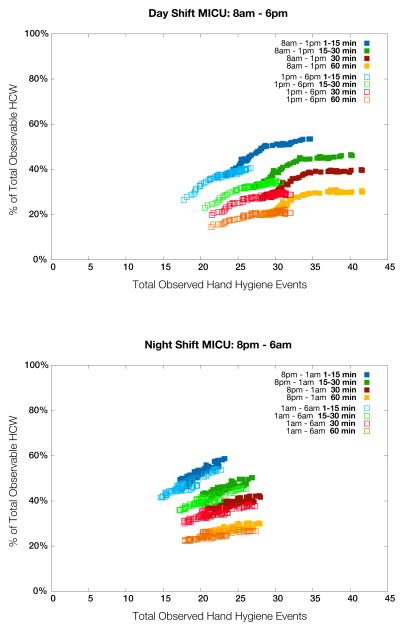
Figure 4.
The relationship between number of hand-hygiene opportunities witnessed and the percentage of healthcare workers seen for each simulated observation schedule: day shift (upper); night shift (lower). Note the pronounced differences between the first and second half of day shifts, which can be partially explained by morning rounds, and how observed behavior is more uniform throughout the night. Similar trends were observed over weekend shifts although reduced staffing levels result in a less pronounced difference between day and night (detail not shown in figure).

