
Figure 2.
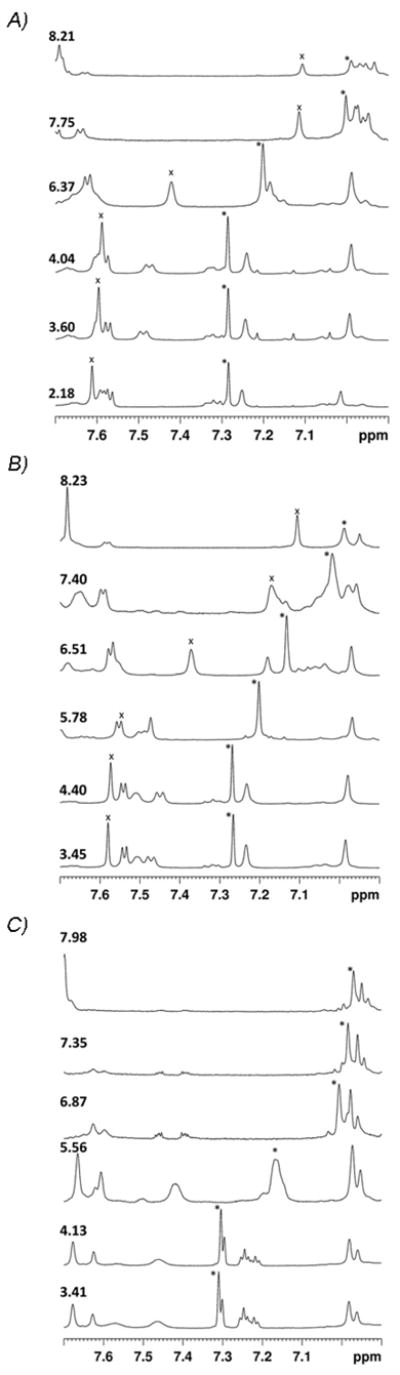
Representative high resolution 1D 1H NMR spectra of A) α-CTxMII, B) α-CTxMII[E11A], and C) α-CTxMII[N5R:E11A:H12K]. The pH value is shown for each spectrum, and the His12 C2H proton is labeled with an “x”, while the His9 C2H proton resonance is labeled with an “*”. In all cases, the spectra are stacked from low pH (bottom) to high pH (top).