
Figure 7.
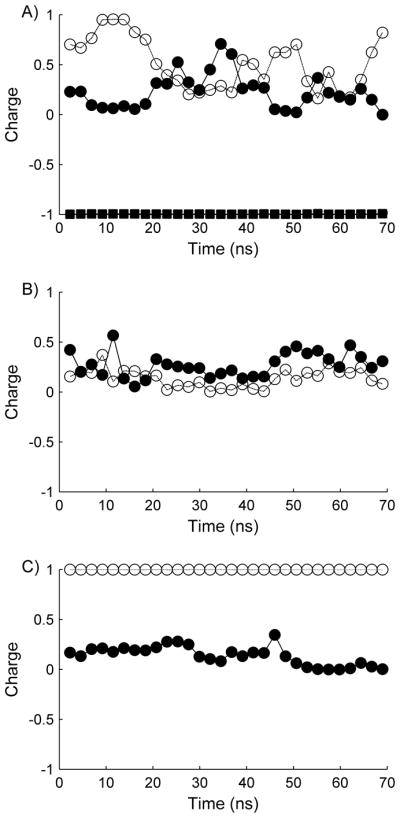
Percent protonation for the various α-CTxMII peptides at pH=7. The graphs depict A) α-CTxMII, B) α-CTxMII[E11A], and C) α-CTxMII[N5R:E11A:H12K] with residue 12 (open circle and dashed line), residue 9 (solid circle and dark line), and residue 11 (solid square and solid line).