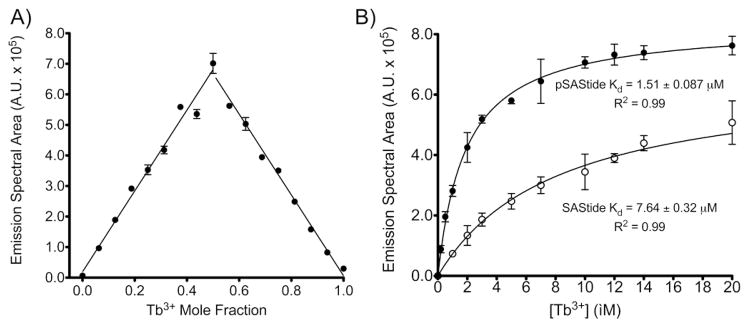
Figure 2.

Characterization of the SAStide/Tb3+ physical interaction. A) Jobs Plot of continuous variation. The mole fraction of Tb3+ and pSAStide were inversely varied relative to each to maintain a total molar concentration of the two species at 16 μM. Luminescence spectra were collected in 10mM HEPES, λex = 266 nm, 1000ms collection time, 50 μsec delay time and sensitivity 180. Data represent averages ± SEM of experiment performed in triplicate. B) Binding affinity of SAStide-terbium complexation. Spectra were collected using 100 nM pSAStide (●) or SAStide (○) in the presence of varying concentrations of Tb3+ in 10mM HEPES, 100mM NaCl, pH 7.5, λex = 266 nm for pSAStide and λex = 275 nm for SAStide, 1000ms collection time, 50 μsec delay time and sensitivity 180. Note that the excitation wavelength used for unphosphorylated SAStide was selected for its own optimal signal sensitivity; therefore the ratio of pSAStide-terbium to SAStide-terbium signals looks less dramatic than when the 266 nm excitation is used for both complexes. Data represent averages ± SEM of experiment performed in triplicate.
