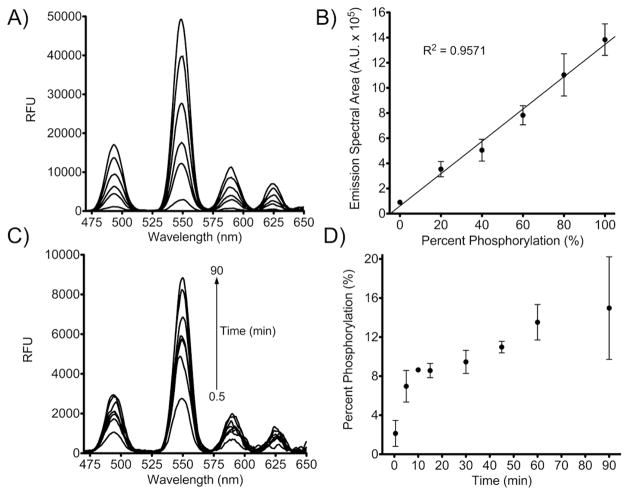
Figure 3.
Calibration and detection of phosphorylation of SAStide. A) pSAStide-Tb3+ luminescence emission spectra in the presence of the quenched Syk in vitro kinase assay buffer (2.4 M urea, 40 μM ATP, 4 mM MgCl2, 0.4 μM Na3VO4, leupeptin, aprotinin, 50 ng/μL BSA and 10 mM HEPES pH 7.5). Spectra were collected from 15 μM peptide in the presence of 100 μM Tb3+ (representing a ratio of 6.7 Tb3+:peptide, which corresponds to the saturated range for 1:1 binding) in 10mM HEPES, 100mM NaCl, pH 7.0, λex=266nm, 1000ms collection time, 50 μsec delay time and sensitivity 180. B) Emission spectral area calibration curve based on percent phosphorylation in vitro. C) in vitro Syk kinase assay luminescence emission spectra. D) Interpolated percent phosphorylation from Syk in vitro kinase assay. Data indicate averages ± SEM of experiments performed in triplicate.

