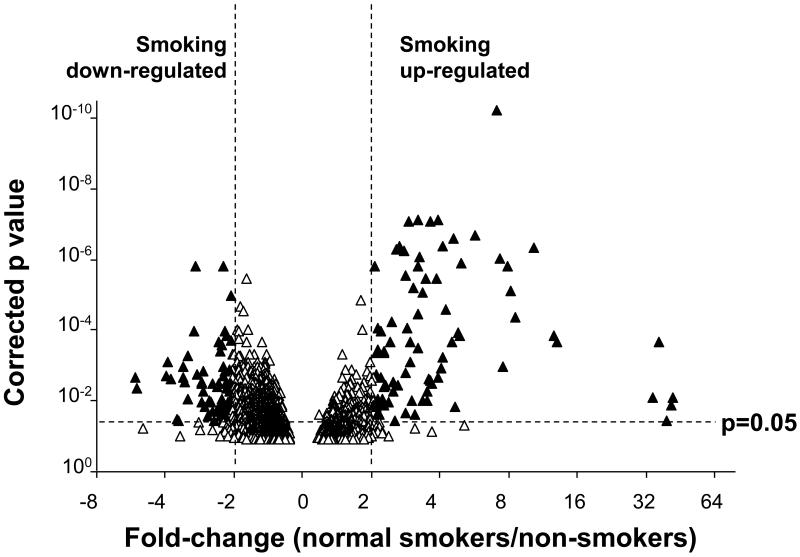
Figure 1.
Impact of smoking on the gene expression profile of the small airway epithelium. The normalized gene expression level for all 54 subjects was determined for all probesets scored as present in >50% of the samples. The natural log (ln) of the ratio of expression levels in normal smokers vs normal non-smokers was plotted against the -log of the p value (paired t test, all normal smokers vs normal nonsmokers; Benjamini-Hochberg corrected). The areas of the plot representing genes that are significantly smoking upregulated and smoking down-regulated genes are indicated.

