Figure 2.
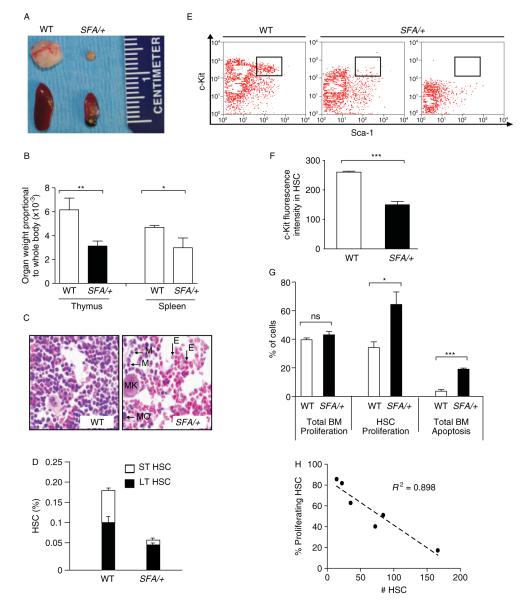
Blood phenotype in SFA/+ mice. (A). A representative picture of thymi and spleens from a severely affected SFA/+ and WT littermate (B) Histogram (mean + SEM, n = 3) of thymus and spleen weights relative to whole body weights in WT and SFA/+ littermates. p = *0.0079 and p = **0.001. (C) H&tE stain of sections from upper femurs of P21-P23 WT and SFA/+ littermates, showing BM with all subtypes of blood cells present, such as megakaryocyte (MK), macrophage (MO), myeloid (M) and erythroid (E) cells. (D) Histogram presenting flow cytometry analysis of short-term (ST) and long-term (LT) HSC numbers (mean + SEM) in flushed BM of P21-P23 mice (n = 6 for WT; n = 10 for severely affected SFA/+), measured by Lin−/lo c-Kit+ Sca-1+ gated cells, which are sorted into Flk-2+ (LT) and FLK-2− (ST). p = 0.0114 for LT and p = 0.001 for ST. (E) Representative flow cytometric analysis of HSCs from flushed BM of P21-P23 WT and severely affected SFA/+ mice. Lin−/lo cells were gated on c-Kit and Sca-1. Small quadrant (R3) represents Sca-1+ c-Kit+ cells which contain the stem cells population. The second panel is representative of staining from most of the affected SFA/+ mice. The third panel shows staining from one of the most affected mice. (F) Quantitation of fluorescence intensity of c-Kit+ cells (mean + SEM) in the R3 HSC quadrant of (E) (n = 6 mice/genotype). ***p < 0.0001. (G) Total BM and HSCs (%) undergoing proliferation (BrdU+ cells) [n = 6/genotype; p = 0.3130 (ns) and *0.0136], and total BM cells (%) undergoing apoptosis (annexin V staining, n = 3/genotype; ***p = 0.0001) measured by flow cytometry (mean + SEM) in WT andseverely affected SFA/+ mice. (H) The relationship between HSC numbers in whole BM and percentage proliferating HSCs (BrdU+ cells) is plotted. A ‘best-fit’ straight dotted line is drawn through the data (linear regression). R2 = square of correlation coefficient.

