
Figure 7.
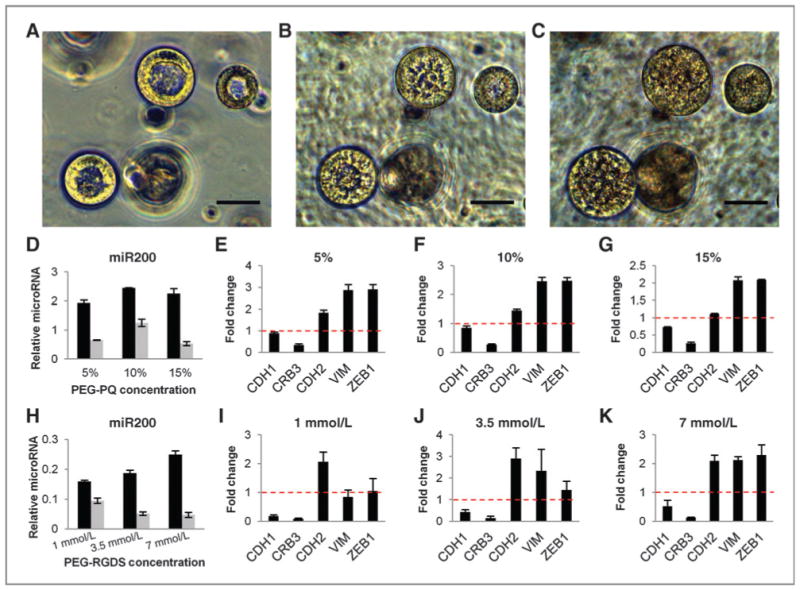
PEG-encapsulated structures show EMT-related morphologic, epigenetic, and gene expression changes with exposure to TGF-β. A–C, bright-field images of lumenized spheres encapsulated in a 5% PEG-PQ, 7 mmol/L PEG-RGDS hydrogel at 12 days in culture before 5 ng/mL TGF-β exposure (A) show breakdown of lumen organization after 1 day of treatment (B) and complete lumen filling and loss of organization after 4 days (C). Scale bar, 50 μm. D–K, q-PCR data for miR-200b before (black bars) and after (gray bars) TGF-β and fold change in mRNA of EMT-related genes with TGF-β treatment in matrices with 3.5 mmol/L PEG-RGDS and varied stiffness (D–G) and matrices with fixed 5% PEG-PQ stiffness and varied PEG-RGDS concentration (H–K) show a decrease in miR-200, decreased expression of epithelial genes (CDH1 and CRB3), and increased expression of mesenchymal genes (CHD2, VIM, and ZEB1) in all matrix formulations following exposure consistent with EMT-related genetic and epigenetic changes seen in 344SQ in Matrigel cultures (for every formulation, miR-200b before vs. after TGF-β, P < 0.01). miR-200 is expressed relative to miR16 levels and fold change mRNA relative to L32 mRNA levels.