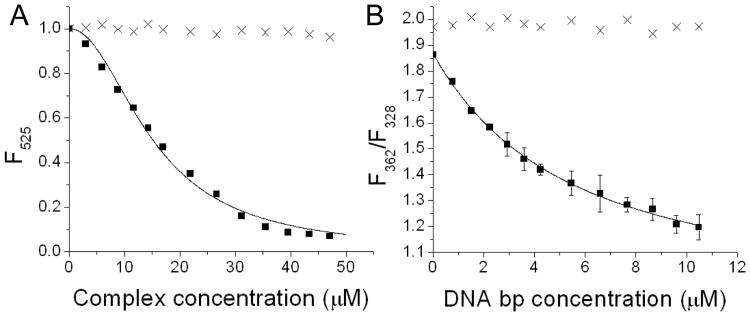
Figure 1.
(A) Titration of Fl-16S A-site RNA with either 1 (■) or the same volumes of buffer lacking peptide (×), monitored by a decrease in fluorescence intensity at 525 nm. (B) Titration of 1 with either supercoiled plasmid DNA (■) or the same volumes lacking DNA (×), monitored by a blueshift in the fluorescence emission of 1. All apparent KD values are shown in Table 1.

