
Figure 4.
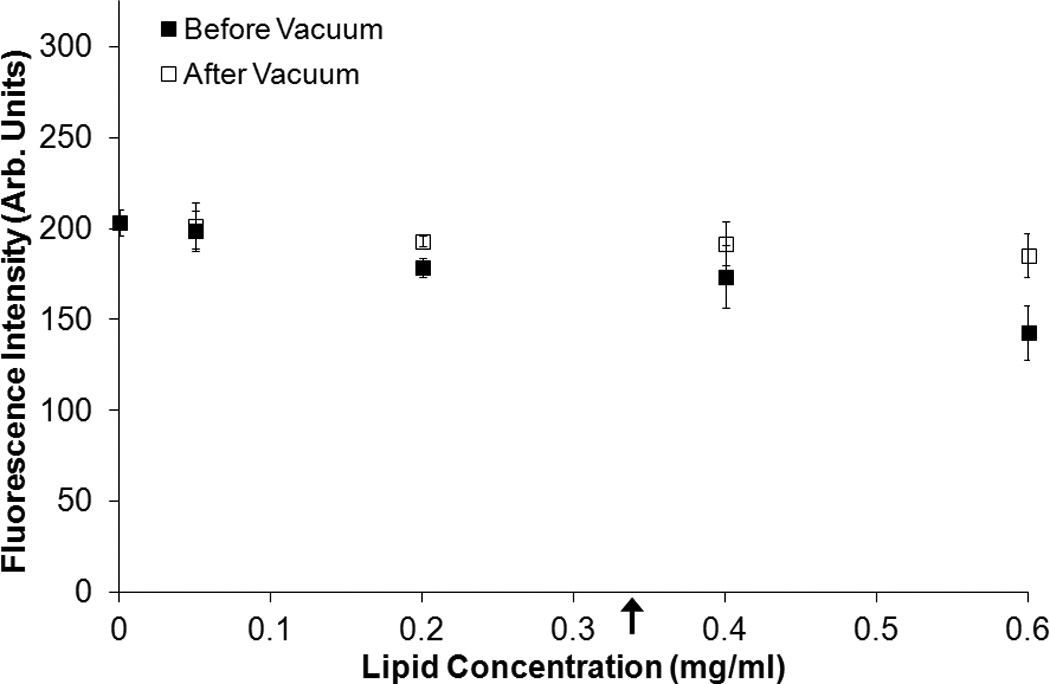
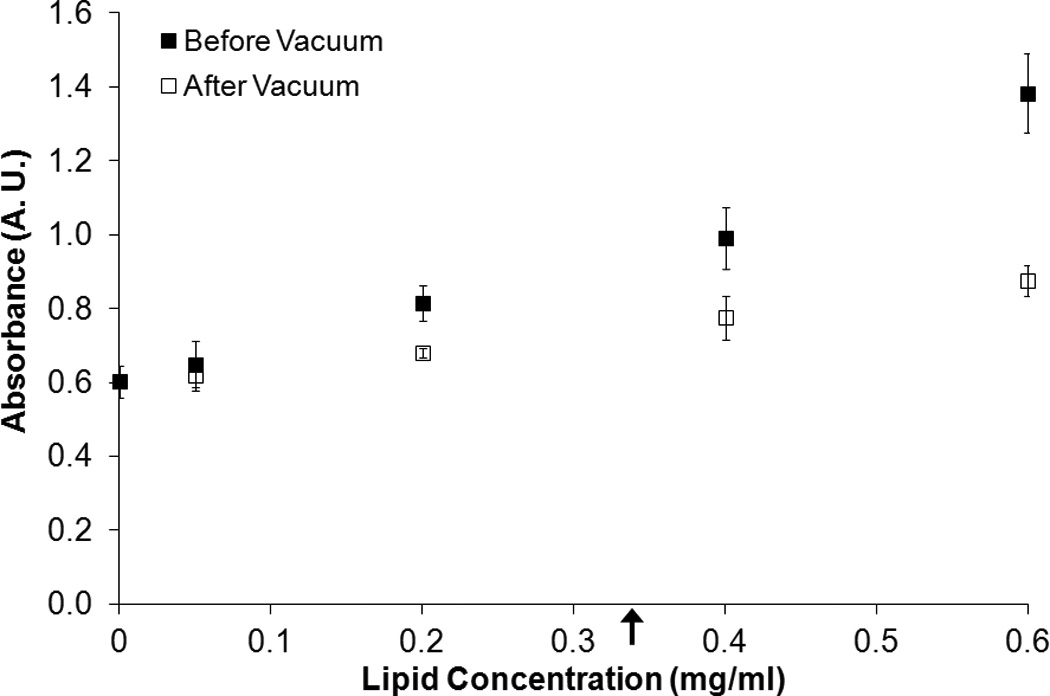
Effect of lipid concentration on fluorescence intensity at a fixed total calcein concentration. The mean (A) fluorescence intensity and (B) absorbance of C-ELIP diluted in calcein solution to 6 µM at different lipid concentrations before and after vacuum treatment is plotted. Error bars represent the standard deviation of measurements from three C-ELIP vials. Arrows indicate the lipid concentrations used in subsequent experiments reported herein.