Figure 1.
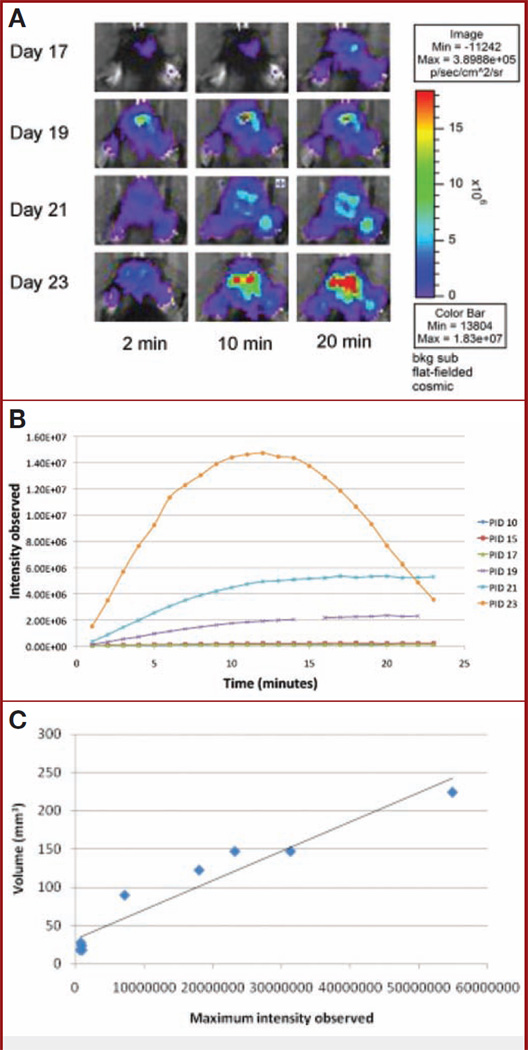
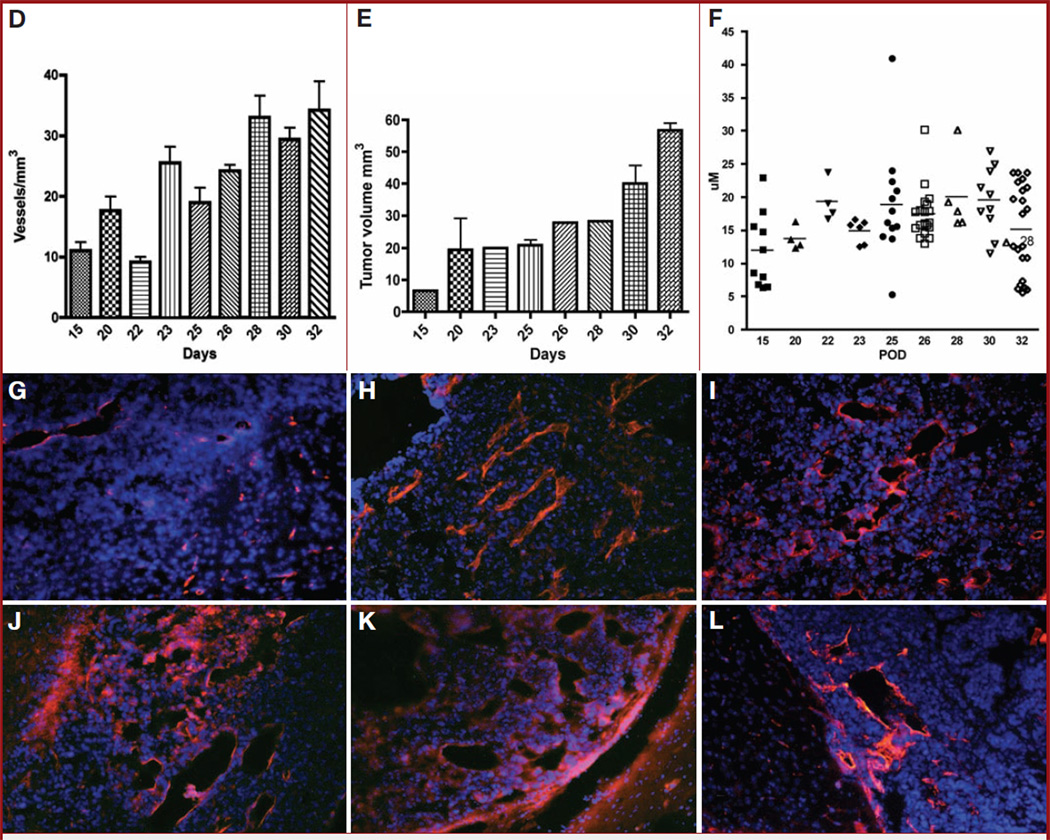
A, dynamic bioluminescence imaging (DBLI) of orthotopic GL26-luc tumor intensity. Firefly luciferase–transfected GL26-luc cells were stereotactically implanted in the right frontal lobe and imaged on postinjection days (PIDs) 17, 19, 21, and 23. Total flux recorded by Living Image software; pseudocolor image reflects photon flux and not necessarily the perimeter of the tumor. As time after intraperitoneal injection of luciferin increases, tumor intensity increases, as it reaches its maximum. As PID increases, tumor intensity also increases, reflecting tumor growth. B, intensity curves of a tumor over the course of an experiment. DBLI images were taken every other day, and observed bioluminescent intensities within regions of interest encompassing the tumor injection site were plotted for each minute. As the tumor grows over time, maximum intensity increases (Im) and the time to reach Im (slope) decreases. Minute 15 of PID 19 was removed, owing to abnormally high background levels of intensity. C, graph showing correlation of maximum intensity and tumor volume. Tumor volume (estimated by (length squared × width)/2, where length is the longer measurement) is directly related to maximum intensity observed on the day that the animal is killed (R2 = 0.93, n = 9). This strong correlation suggests that bioluminescence imaging is representative of tumor volume. D, graph showing that vascular volume density (mm3) increases over the time points of the experiment. The results of a representative experiment are shown. E, graph showing that tumor volume (mm3) increases over the time course of the experiment. The results of a representative experiment are shown. F, plot showing that vascular caliber (µm) gradually increases from day 0 to day 28 (P < .04). POD, postoperative day. G–L, representative histologic sections representing tumor growth at various time points (G, day 10; H, day 15; I, day 17; J, day 19; K, day 21; L, day 23) over the course of the experiment, illustrating the observed increase in vascular caliber (blue, nuclei, 4′,6-diamidino-2-phenylindole; red, vascular endothelium, CD31).


