
Figure 1.
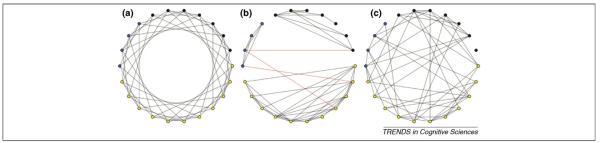
Schematic depicting regular, small-world and random graphs. Small-world graphs can be generated by replacing local connections in regular (lattice) graphs with longer-range short-cuts. (a) Sample regular graph (lattice) containing 22 nodes and 52 edges. In regular graphs, each node is only connected to the next n nodes around the ring in a regular pattern. Regular graphs have long Lp and high Cp. (b) Data-derived graph containing 22 nodes [regions of interest (ROIs)] and 52 edges (functional connections) that seems small-world-like. Densely intraconnected clusters (black, yellow and blue) are linked through long-range short cuts (highlighted in red). Small-world networks are ’clumpy’, as reflected by high Cp and much shorter Lp than regular graphs. This type of network organization enables faster information transfer between any pair of nodes. (c) Sample random graph containing 22 nodes and 52 edges. Random graphs have moderately short Lp and low Cp. Functional connectivity diagrams of actual brain regions are neither regular nor random but more small-world like.