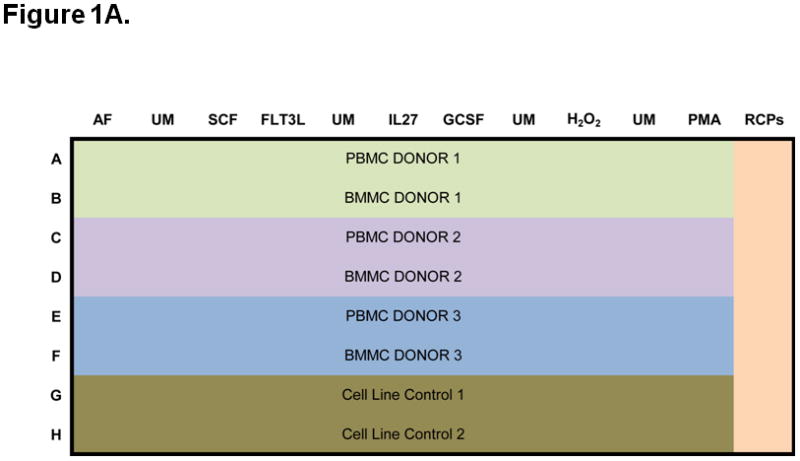
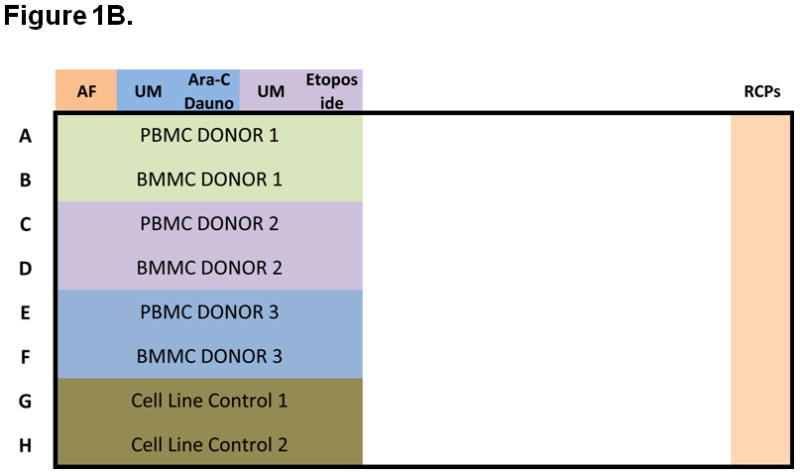
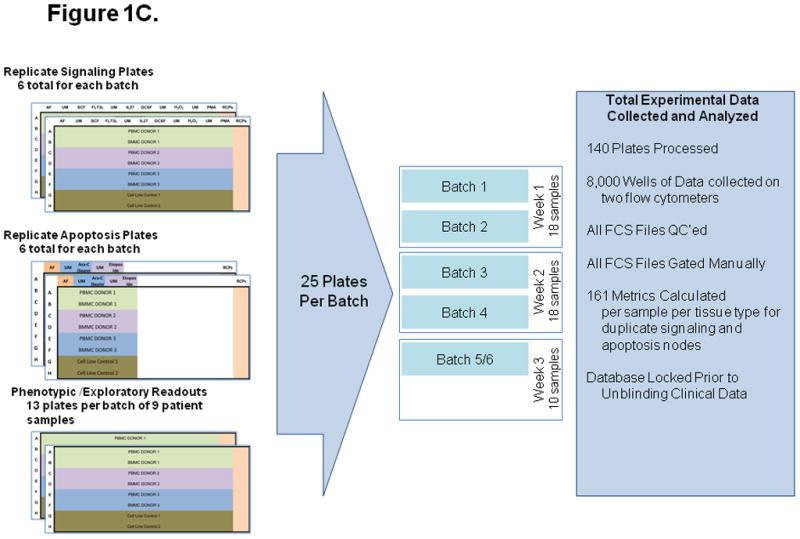
Figure 1. Experimental setup, including signaling and apoptosis plate layouts.


A) Signaling plates layout. Each plate contains PB and BM samples from 3 AML patients (rows A to F). Experiment conditions are shown across the top, with an autofluorescence well (AF), followed by an unmodulated reference well (UM) and the associated modulated wells, shown color-coded. A total of six modulated conditions and four associated unmodulated conditions are tested in this plate format. Column 12 contains rainbow control particles (RCPs) used to calibrate the fluorescence readouts on a plate-by-plate basis. Rows G and H contain cell line controls (GDM-1/U937 mix and RS4;11) used to monitor the modulation, fixation, permeabilization, and staining processes. Each plate is setup using a laboratory management system which populates sample, reagent, antibody cocktails, modulators, cytometer and other settings used to track information during the conduct of the experiment. B) Apoptosis plates layout. As in the signaling plates, each apoptosis plates contain a total of 3 paired PB and BM samples, cell line controls, and rainbow control particles (RCPs) in column 12. One autofluorescence column is included as a reference. Unmodulated (UM) and modulated columns are used to assess response to Ara-C/Daunorubicin (Ara-C Dauno) and Etoposide. C) Each signaling and each apoptosis plate was run in duplicate, setup with the laboratory management system and data tracking was managed throughout the experiment.
