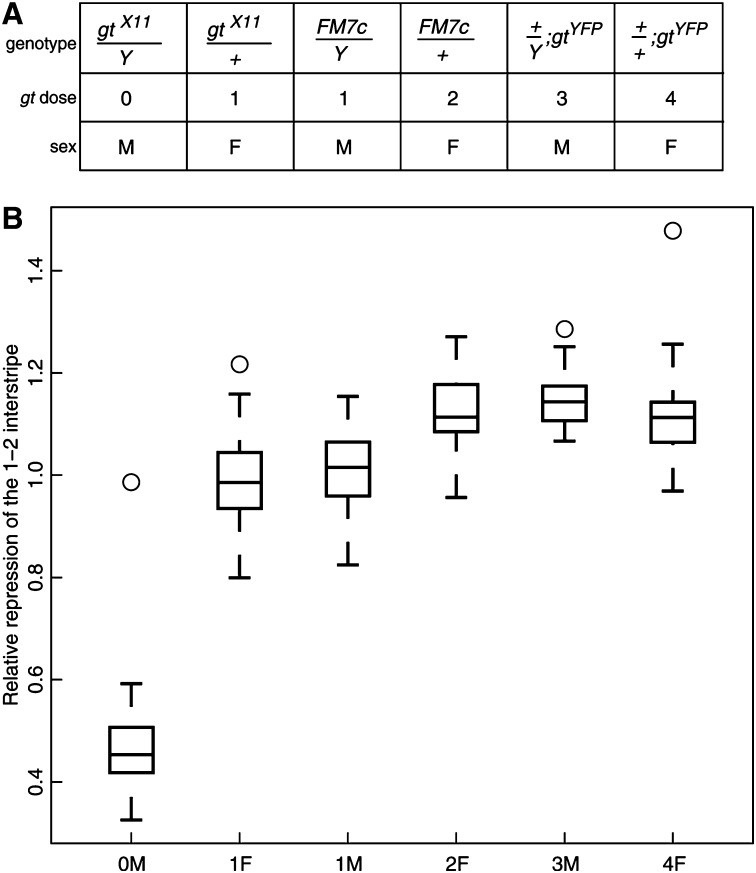
Figure 3.
The response of stripe 2 relative repression to gt dose. (A) The genotypes used to make a dosage series for gt. (B) Response of the relative repression of the 1–2 interstripe to gt dose. Relative repression was measured as before (Figure 1, D and E). Embryos were at mid-cycle 14. n = 13, 28, 16, 14, 22, 17.

