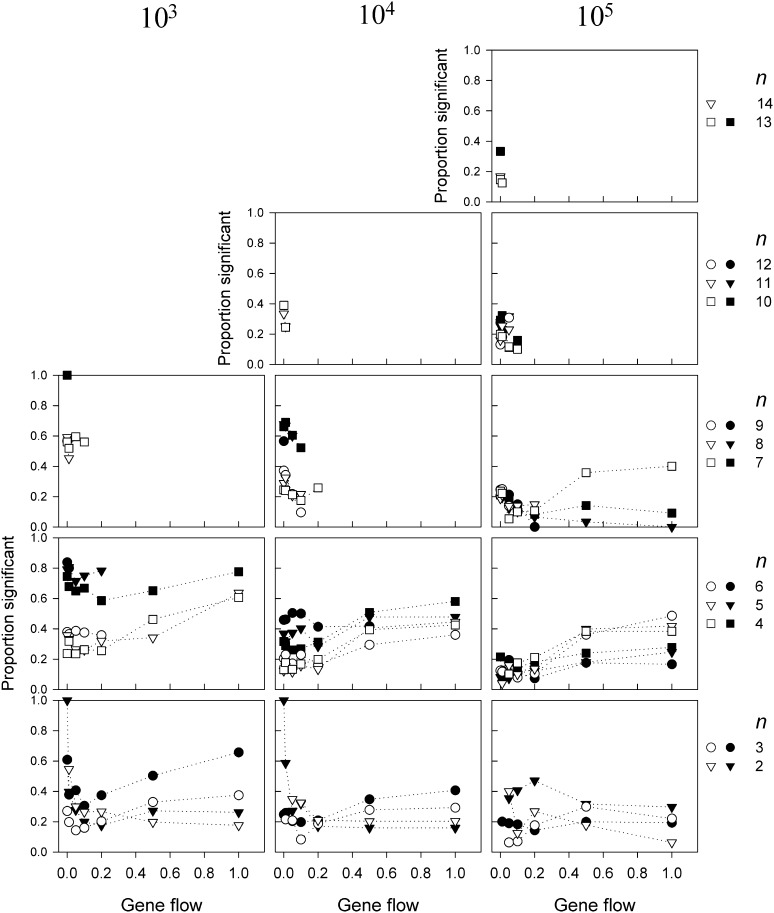
Figure 5.
The proportion of pooled allele-frequency vectors that were significantly different from neutral according to the Ewens–Watterson test for neutrality as a function of gene flow for three different population sizes N and n > 1. The solid symbols indicate the results for populations with random drift whereas the open symbols indicate those without. Allele-frequency vectors were rejected if 18 or more of the generated sample homozygosity values were outside the critical range of Ewens sampling distribution (see text for explanation). Only combinations of N, m and n are shown for which at least 10 replicates were found.

