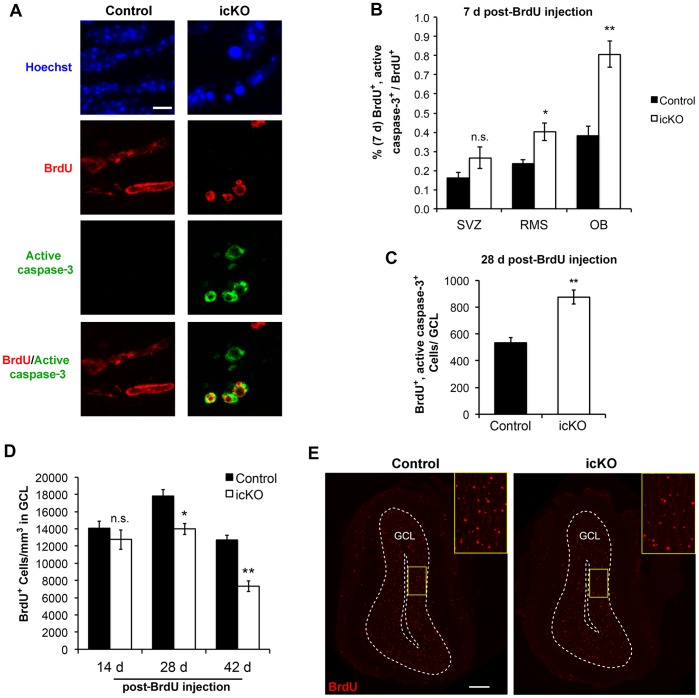
Figure 9. ERK5 icKO inhibits survival of newborn cells in the OB.
(A) Representative immunostaining of active caspase-3 (green) and BrdU (red) at 7 d post-BrdU injection in the OB. Hoechst stained nuclei (blue). Scale bar represents 5 µm and applies to all panels. (B) Quantification of active caspase-3+ cells in BrdU+ cell population at 7 d post-BrdU injection. (C) Quantification of total active caspase-3+ and BrdU+ cells at 28 d post-BrdU injection. (D) Quantification of BrdU+ cell density in the GCL of the OB, at 14, 28 and 42 d post-BrdU injection. (E) Representative images of BrdU staining (red) at 28 d post-BrdU injection. The yellow rectangles outline the enlarged areas, shown in the insets, for clearer visualization. Scale bar represents 250 µm. n = 4 individual olfactory bulbs per group. n.s. not significant; *, p<0.05; **, p<0.01.

