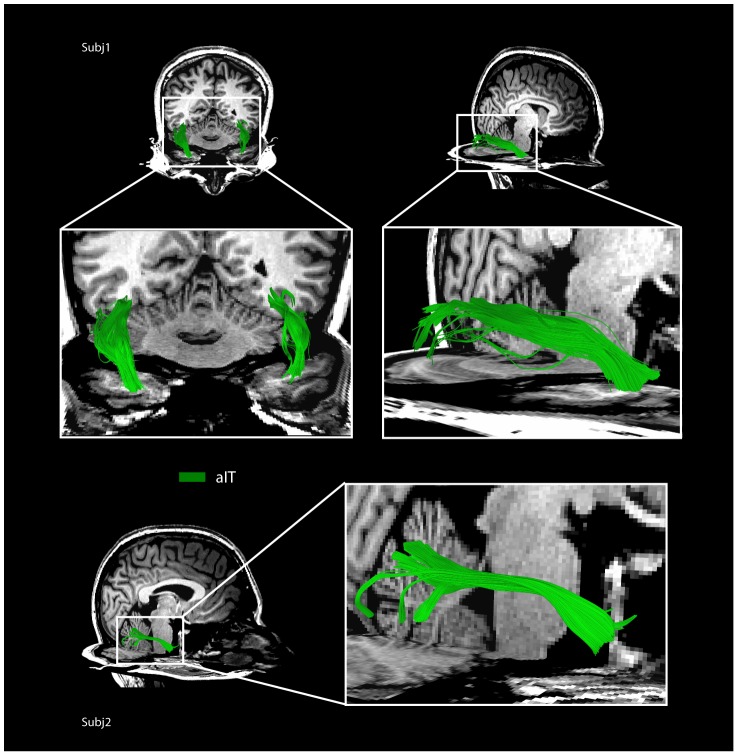
Figure 5. Fiber tracks connecting right mFus to aIT in two representative participants.
In Subj1, two views are shown: partial bilateral tracks from above shown intersecting a coronal co-registered T1 anatomical slice (upper left), and the complete right track shown from the side (upper right). Note good correspondence between white matter in the T1 anatomical and the location of fiber tracks passing through the coronal slice. In Subj2 a complete right hemisphere track is shown from the side.

