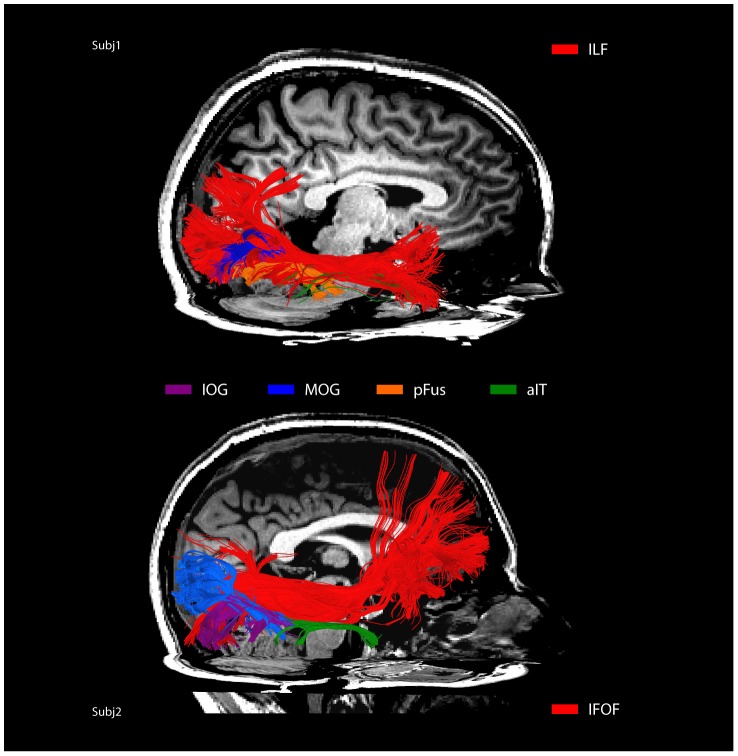
Figure 7. Spatial overlap of right ILF and IFOF with mFus connected tracks in two representative participants.
The major ILF and IFOF tracts are colored red, and the mFus connected tracks are colored to correspond with their target ROIs. IFOF is show in the top participant and ILF in the bottom participant.

