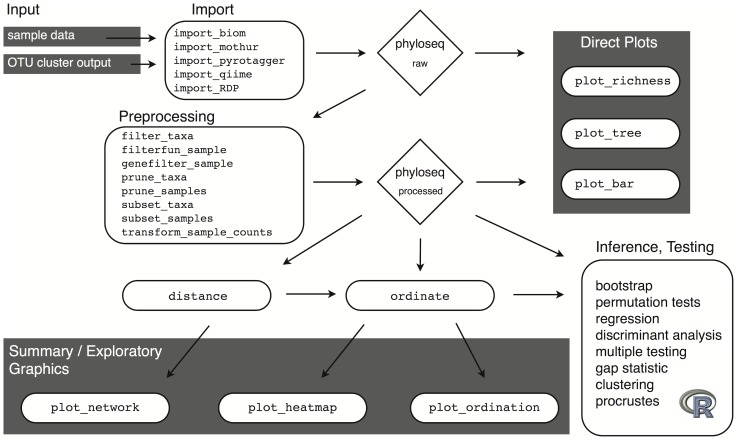
Figure 2. Analysis workflow using phyloseq.
The workflow starts with the results of OTU clustering and independently-measured sample data (Input, top left), and ends at various analytic procedures available in R for inference and validation. In between are key functions for preprocessing and graphics. Rounded rectangles and diamond shapes represent functions and data objects, respectively, further described in Figure 3.

