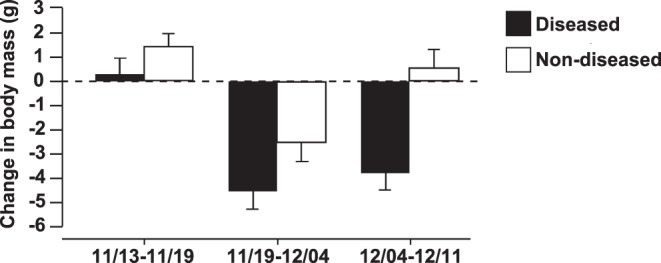
Figure 2. Change in body mass throughout infection.

Average change in body mass (±1 standard error) of Litoria caerulea that eventually became diseased (n = 9) or remained non-diseased (n = 14) for chytridiomycosis between dates leading up to sacrifice on 12/12/09. Disease states were statistically different (Repeated measures ANOVA, Disease status: P<0.001, F1,21 = 38.06, Time: P<0.001, F1,42 = 12.25, Disease status × Time: P = 0.2).
