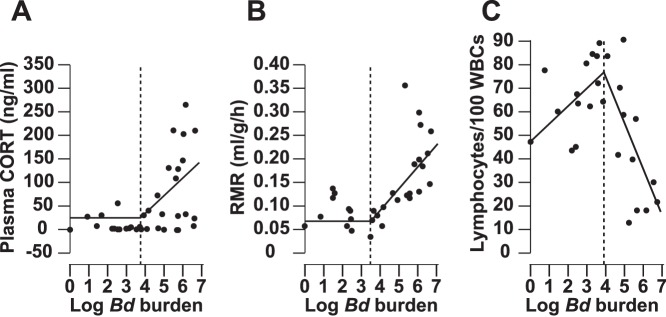
Figure 5. Changes in variables at different Bd burdens.

Segmented regressions of plasma corticosterone (CORT, Fig. 5A), resting metabolic rate (RMR, Fig. 5B), and lymphocyte abundances (Fig. 5C) of Litoria caerulea during an outbreak of chytridiomycosis. Horizontal and vertical dotted lines indicate X and Y axes, respectively. Vertical dashed lines indicate breakpoints at which the dependent variables changed significantly. Black lines indicate the two segments fit to the data before and after the breakpoint. The zoospore breakpoints for CORT, RMR, and lymphocytes were 4,940; 4,066; and 10,778 zoospores, respectively. Data before and after the breakpoint were significantly different for all three variables (Segmented regression, P<0.05). Linear regressions suggested significant relationships between Bd burden and CORT (R2 = 0.25, P = 0.002, F1,35 = 11.40), RMR (R2 = 0.46, P<0.001, F1,22 = 18.16), and lymphocytes (R2 = 0.20, P = 0.022, F1,25 = 5.96).
