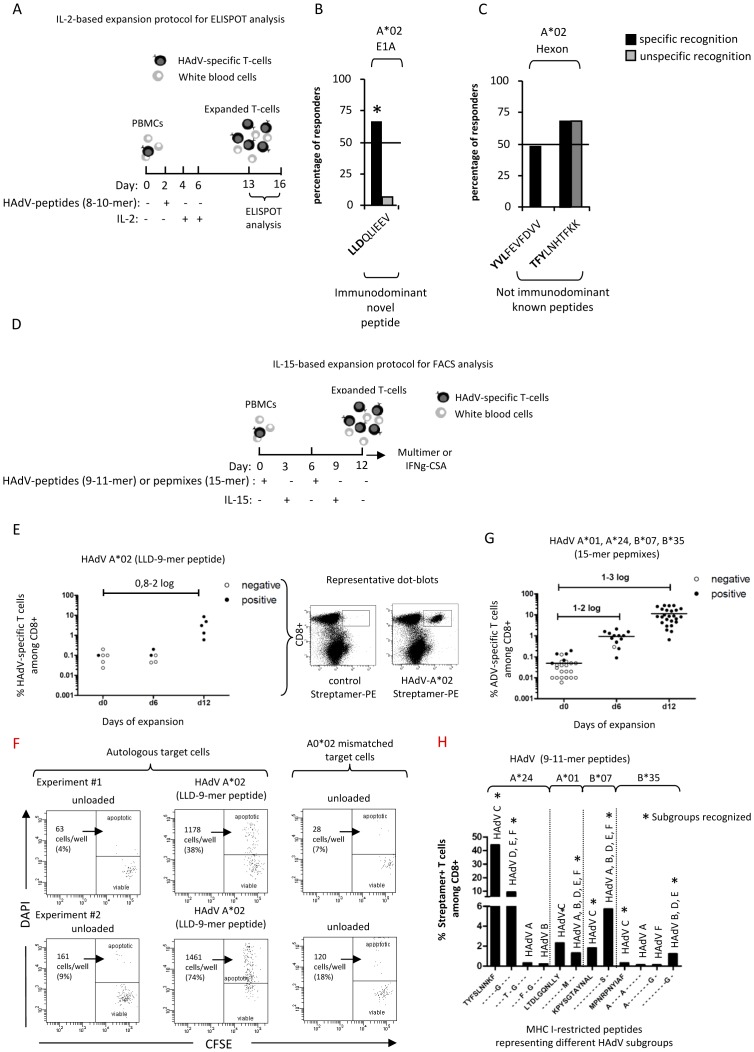
Figure 1. Frequency of responses to novel and known HAdV peptides by ELIspot.
Frequency of HAdV-specific T-cells in donors before and after short-term in vitro expansion analyzed by multimers and IFNg-CSA. A) Schematic drawing of the IL-2-based in vitro expansion protocol for ELIspot analysis. Percentage of donors responding to novel B) and known C) A*02-based peptides by ELIspot assay. Black bars represent donors positive, gray bars those negative for the respective allele. Significant differences are indicated (*, p>0.05, Fisheŕs exact test). D) Schematic drawing of the IL-15-based in vitro expansion protocol for FACS analysis. E) Percentages of A*02 ADV-streptamer+ T-cells including representative dot plots are given. F) Specific lysis is shown of autologous and allogeneic A*02 mismatched PHA-blasts (target cells), unloaded- or HAdV-A*02 (LLD) peptide-loaded, induced by A*02-multimer-sorted HAdV-T-cells. The total number of “dying” target cells/well and percentage values were evaluated from each sample. Two representative dot plots are shown. G) A*01, A*24, B*07, and B*35 HLA- dependent ADV-specific multimer+ (streptamer or pentamer) T-cells among CD8+ T-cells, before (day0) and after 6 and 12 days of expansion are shown. Notably, for some donors, multimer analyses were only performed at day 0, 6 and/or 12. H) Subgroup C-derived streptamer staining of PBMCs stimulated with specific peptides for 12 days, representing different adenoviral subgroups, as indicated. The percentage of streptamer+ T cells among CD8+ is shown. Asterisks represent subgroup recognition.

