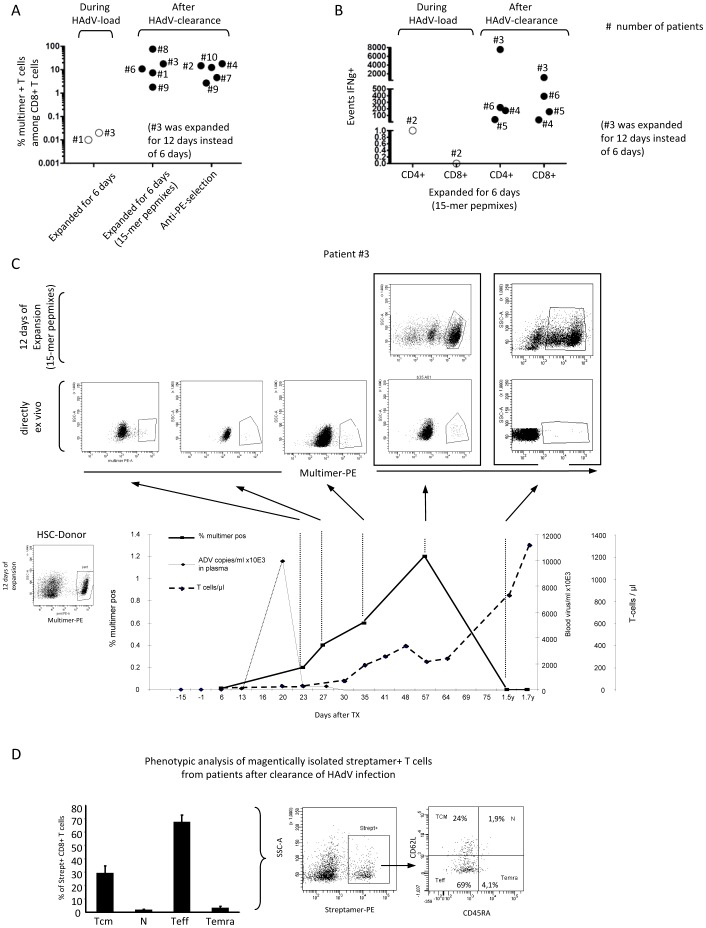
Figure 2. Analysis of HAdV-specific T-cells in patients during and after allogeneic SCT.
The presence of 6 day expanded or magnetically isolated HAdV-specific T-cells was assessed by A) the percentage of multimer+ T-cells among CD8+ and by B) events of IFN-γ secreting CD4+ and CD8+ T-cells during HAdV load, or after ADV clearance in 10 patients. Of note, for most patients, either multimer or IFN-γ assays before or after viral load were performed. Each dot refers to the appropriate patient number, as indicated.C) Detailed analysis of ADV-multimer+ T-cells of patient No. 3 and the representative HSC-donor are shown. Dot plots show the percentage of HAdV-multimer+ T-cells among CD8+ at several time points after clearance of HAdV plasma load. For the last two stainings, cells were measured directly ex vivo and after a 12 instead of 6 day expansion period. The graphs show percentage of HAdV-multimer+ T-cells among CD8+ (bold line, rectangle), HAdV copies per ml serum (dotted line, diamond) and number of CD3+ T-cells/µl blood (bold line, diamond). D) A summarizing diagram + SEM (of patients No. 2, 4, 7, 9 and 10) including representative dot plots of magnetically isolated HAdV-streptamer+ T-cells and percentages of their 4 subsets of naïve (N), central (TCM), effector memory (TEM) and effector memory CD45RA+ (TEMRA) T-cells are shown.

